Organic country: the number of conventional farms is falling as the number of organic farms rises
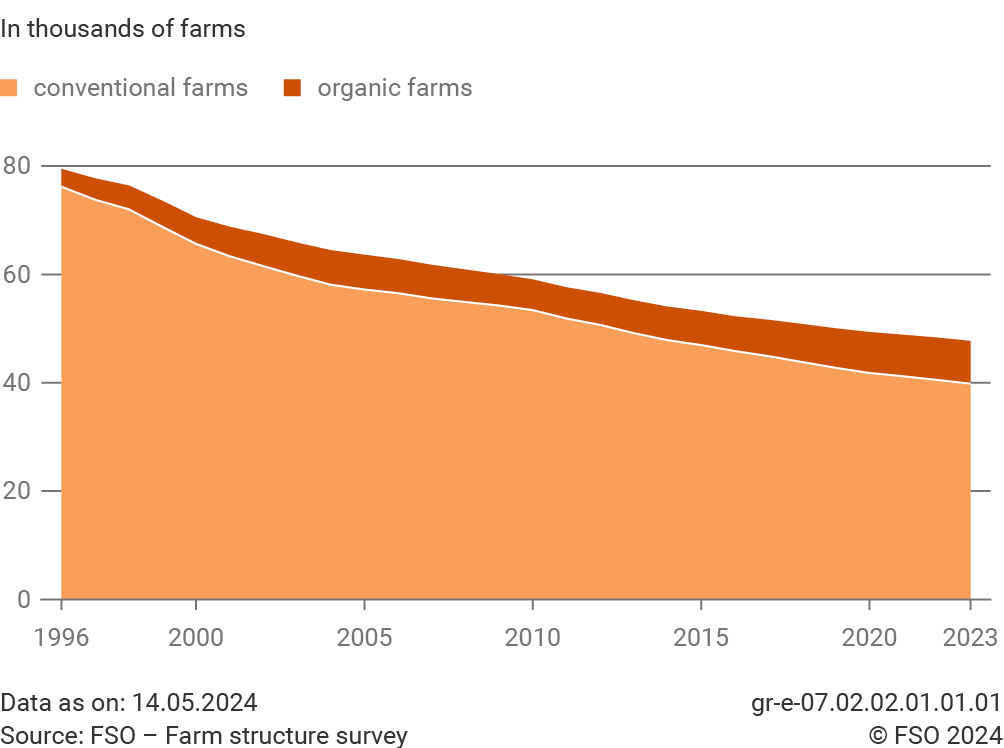
Structure of farms, 2023
| Total | % | of which organic | % | |
|---|---|---|---|---|
| Farms | 47 719 | 7 896 | ||
| Orientation: animal production | 32 138 | 67 | 5 490 | 70 |
| Orientation: plant production | 11 649 | 24 | 1 742 | 22 |
| Orientation: mixed production | 3 932 | 8 | 664 | 8 |
| Farms with direct sales (2020) | 12 700 | 3 200 | ||
| Jobs | 148 900 | 27 700 | ||
| Average farm size in hectares | 22 | 24 | ||
| Utilised agricultural area in hectares | 1 042 000 | 190 000 | ||
| owner-occupied (2020) | 54 | 52 | ||
| leased (2020) | 44 | 45 | ||
| in usufruct (2020) | 2 | 3 | ||
| Agricultural vehicles, stock 2023 | 197 700 | … |
Source: FSO – Farm structure survey, Additional survey, Distribution of road vehicles
© FSO 2024
A workplace in the countryside: 37% of jobs
in agriculture are held by women

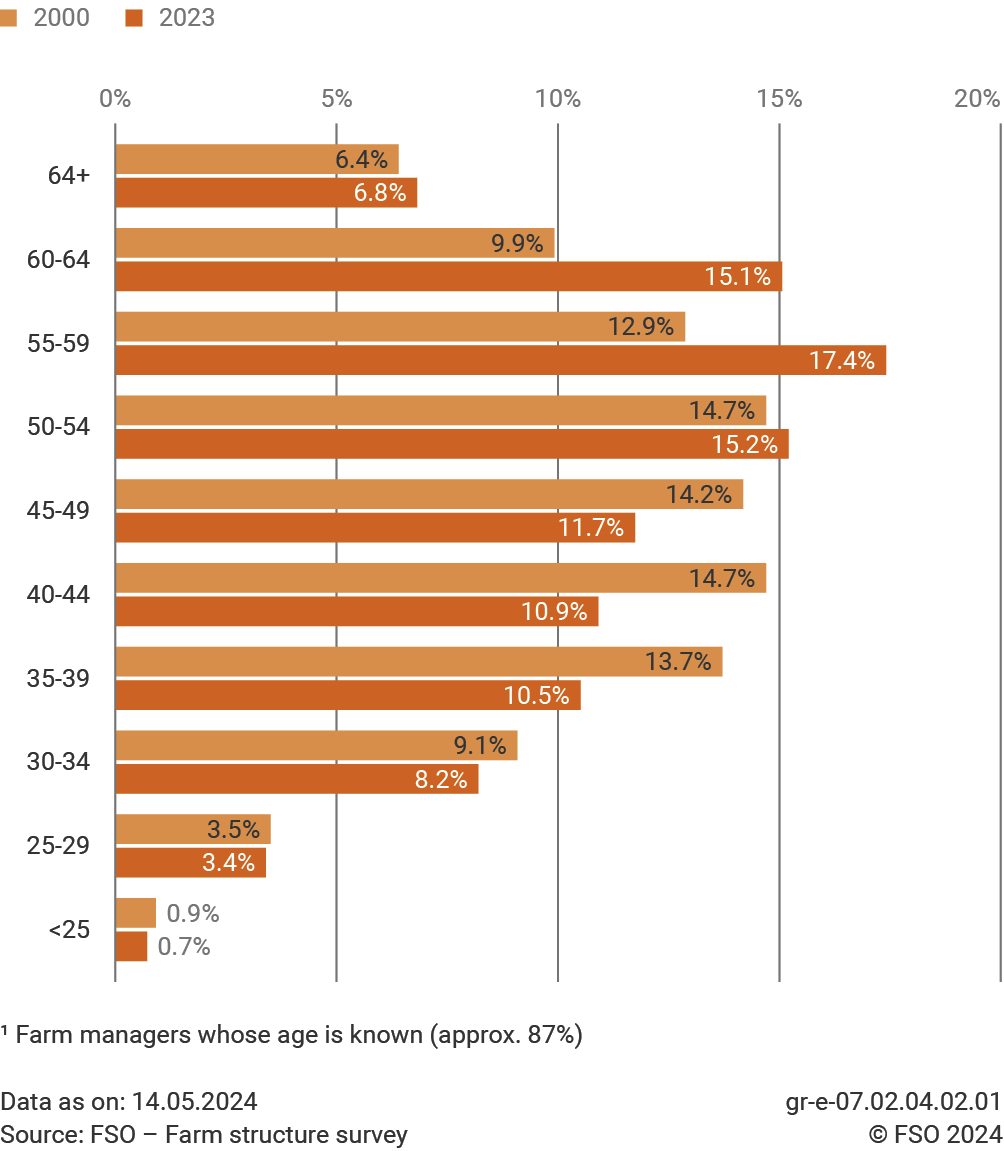
Age pyramide: 55% of farm managers1 are
aged over 50
Grassland: 7 out of 10 hectares are meadows
or pastures

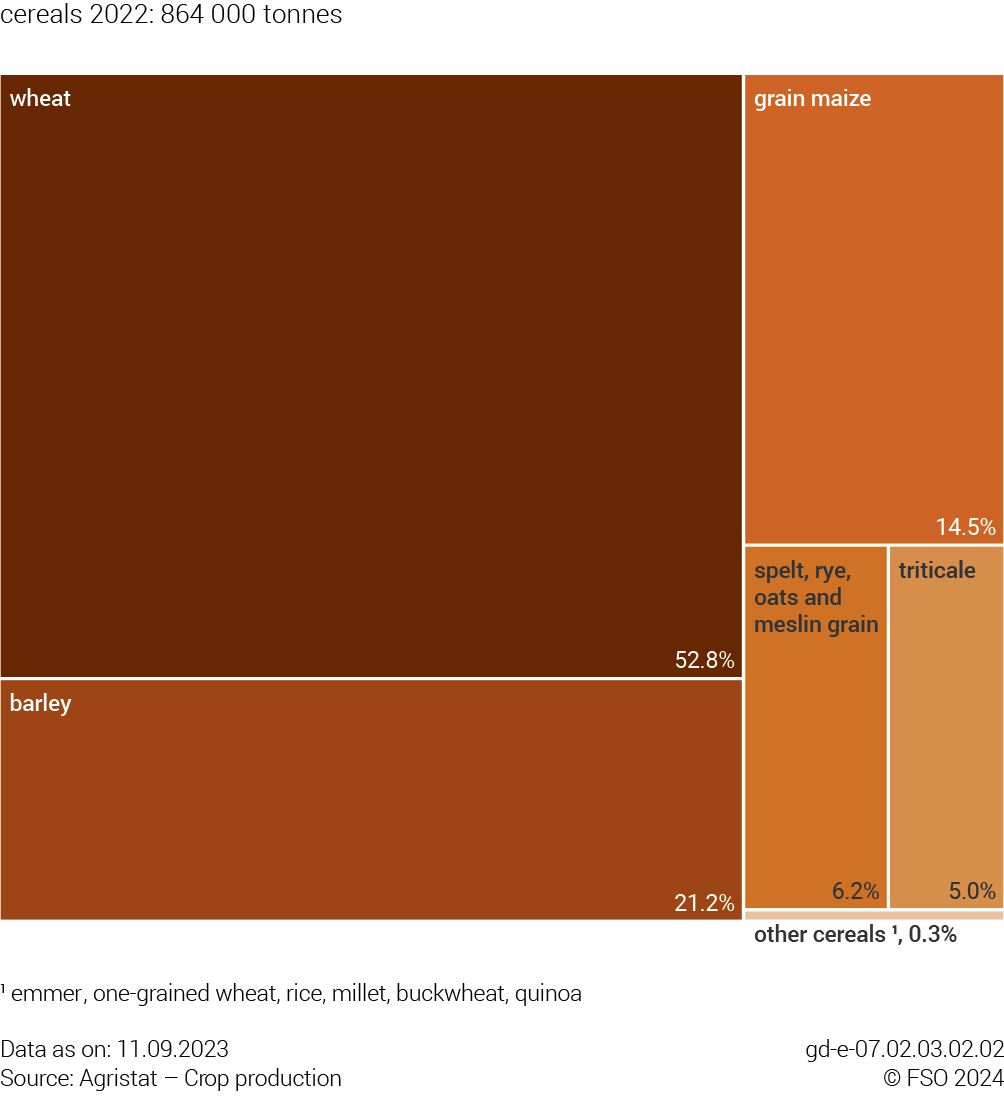
The essential arable crop: wheat is the main cereal
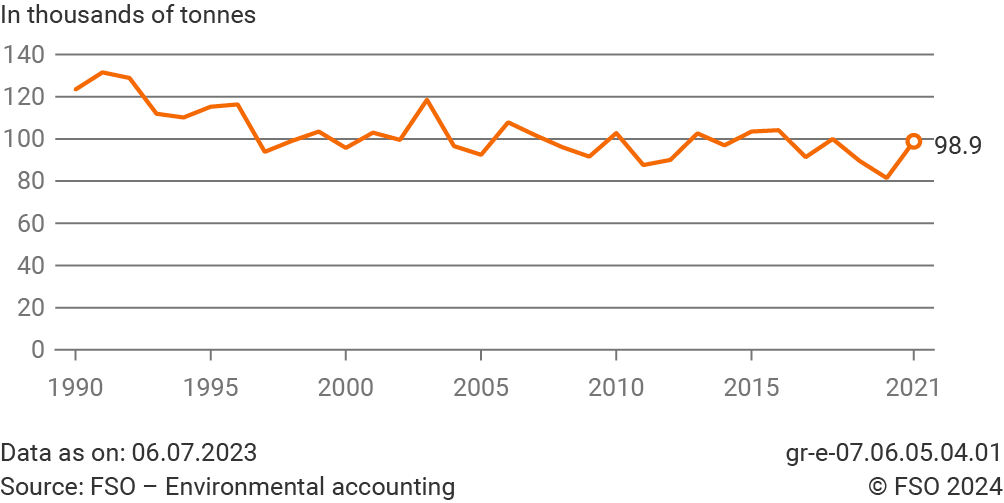
Oil fields: increasing rapeseed cultivation area

Milky Way: 532 000 cows produced 3.7bn kg
milk, 2023

Chicken Run: twice as many hens as in 1996

| Animals 1 | 2023 |
|---|---|
| Cattle | 1,5 millions20% of which in the canton of Berne |
| Farms with tie stalls (2020) | 20 000 |
|
Farms with free-stall systems (2020) |
33 000 |
| Pigs | 1,3 millions31% of which in the canton of Lucerne |
| Horses | 82 000 |
| Sheep | 362 000 |
| Goats | 81 000 |
| Chickens | 13,2 millions |
1 Rounded
Source: FSO – Farm structure survey, Additional survey
© FSO 2024
Key cantonal figures for agriculture, 2023
| Cantons | Farms | Of which organic farms | Jobs in thousands | Utilised agricultural area in thousands of hectares | Cattle in thousands |
|---|---|---|---|---|---|
| ZH | 3 014 | 489 | 10.8 | 72 | 91.5 |
| BE | 9 734 | 1 445 | 29.4 | 191 | 298.4 |
| LU | 4 301 | 483 | 12.7 | 75 | 147.8 |
| UR | 521 | 61 | 1.3 | 7 | 11.0 |
| SZ | 1 472 | 184 | 3.9 | 24 | 43.4 |
| OW | 595 | 193 | 1.5 | 8 | 18.5 |
| NW | 398 | 83 | 1.1 | 6 | 11.3 |
| GL | 336 | 100 | 0.9 | 7 | 11.7 |
| ZG | 535 | 95 | 1.7 | 11 | 19.3 |
| FR | 2 598 | 250 | 8.3 | 75 | 133.9 |
| SO | 1 281 | 194 | 3.8 | 31 | 41.0 |
| BS | 13 | 3 | 0.1 | 0,4 | 0.3 |
| BL | 874 | 169 | 2.8 | 21 | 25.4 |
| SH | 498 | 52 | 1.6 | 16 | 17.0 |
| AR | 655 | 132 | 1.5 | 12 | 22.4 |
| AI | 417 | 26 | 1.0 | 7 | 14.4 |
| SG | 3 707 | 499 | 10.4 | 71 | 136.0 |
| GR | 2 138 | 1 261 | 6.1 | 56 | 69.2 |
| AG | 2 931 | 330 | 9.3 | 59 | 86.5 |
| TG | 2 429 | 399 | 8.3 | 49 | 70.4 |
| TI | 1 027 | 179 | 3.0 | 14 | 10.8 |
| VD | 3 534 | 450 | 12.4 | 108 | 112.6 |
| VS | 2 585 | 401 | 9.9 | 36 | 31.4 |
| NE | 752 | 124 | 2.2 | 32 | 42.4 |
| GE | 396 | 88 | 2.0 | 11 | 3.2 |
| JU | 978 | 206 | 2.8 | 41 | 58.9 |
| Switzerland | 47 719 | 7 896 | 148.9 | 1 042 | 1 528.6 |
Source: FSO – Farm structure survey, STATENT, STATPOP
© FSO 2024
Nitrogen balance: nitrogen input exceeds agricultural crop requirements
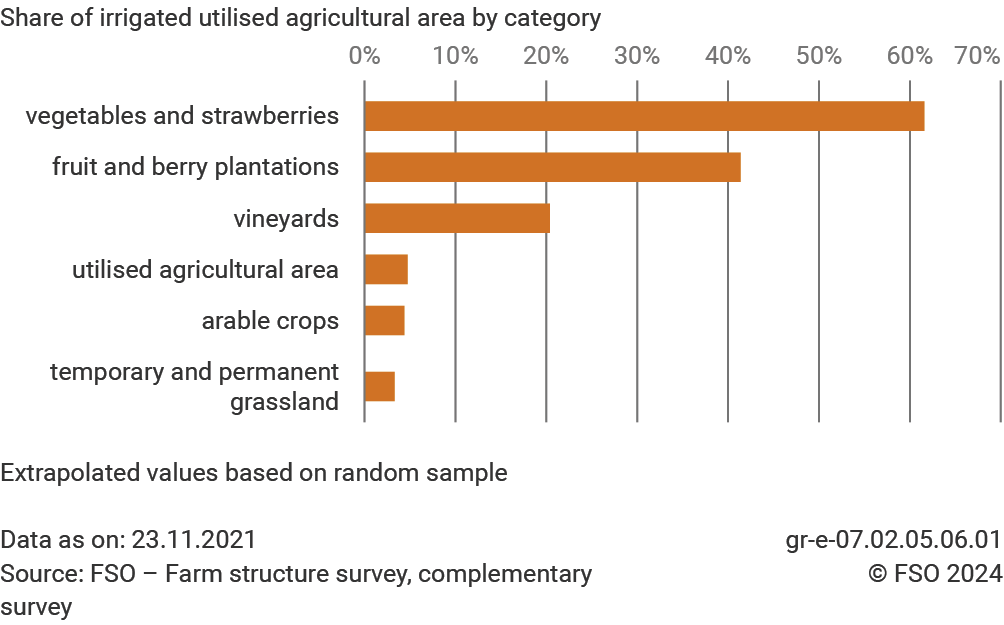
Irrigation: approximately 5% or 49 000 hectares of the utilised agricultural area is irrigated, 2020
Food security: Swiss agricultural produces
53% of food

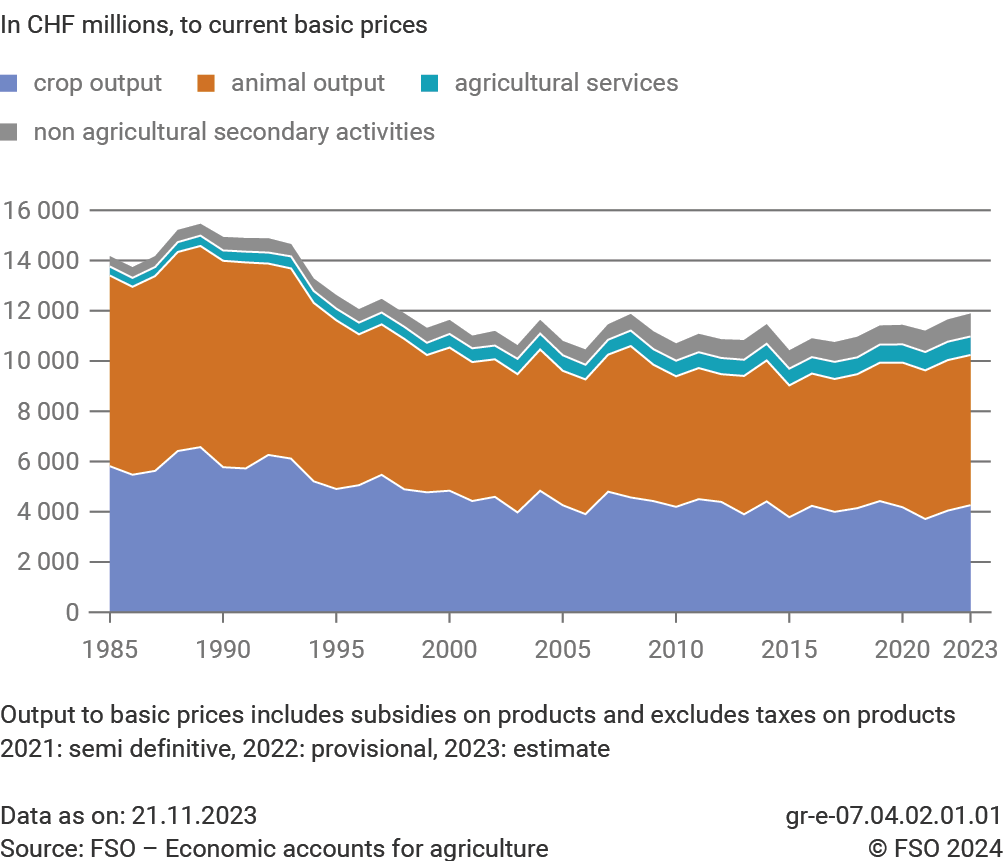
$Output: 50% of the production value comes
from animal production and 36% from plant
Visit our website:
www.statistics.admin.ch → Look for statistics → 07 – Agriculture and forestry
Subscribe to our newsletter:
www.statistics.admin.ch → Services → Contact → Orders and subscriptions