

Overview 2012–2022
Obesity and hospitalisations
This publication focuses on the hospitalised population in Switzerland during the period 2012–2022, exploiting information from the Medical Statistics of Hospitals (MS), a comprehensive and mandatory data collection from the FSO. The study aims to assess the differences between obesity-related and non-obesity related hospitalisations, analysing different aspects such as the length of the hospitalisation, co-morbidity, treatments and fatality events. The study also focuses on the differences between the two groups regarding patients’ socio-demographic features. Over the period 2012–2022, the share of hospitalisations with obesity as the primary diagnosis stayed constant (on average 0.3%). Hospitalisations with obesity as a diagnosis take longer, on average, they are associated with a larger number of diagnoses and they are less likely to be correlated with a fatality event. However, when focusing on cases with a specific main diagnosis (for example, “Diseases of the circulatory system”), obesity materially increases the occurrence of a fatality event. Regression results also show that obesity increases the duration of hospitalisation. Finally, it has been found that obesity is correlated with gender (it is more likely among females), age classes (in relative terms, obesity cases “dominate” age cohorts from 25–34 to 65–74), nationality (obesity is more likely among non-Swiss patients) and areas of geographical provenance (obesity cases are more frequent among patients living in rural areas).
Obesity as a pathology
Obesity is a severe form of being overweight, characterised by excess body fat, which can lead to health problems. Obesity is often determined using the body mass index (BMI). see Appendix A for further details on BMI According to the World Health Organization (WHO), a lack of physical activity and a diet that is both too high in calories and too low in fruit and vegetables are the determining factors for becoming overweight and the onset of obesity. Obesity is one of the main risk factors for several diseases. As a result, the life expectancy of obese people is shorter than that of people of normal weight (see for instance [1]). According to [6], in 2022 12% of the Swiss population was obese, resulting in a one percentage point increase compared with the previous survey (in 2017). In twenty years, this proportion more than doubled (in 1992 it was 5%).
In this study, we focus on hospitalisations. A hospitalisation case, defined as such whenever a hospitalised patient is discharged, transferred to another hospital, or deceased, has been flagged as obesity-related if obesity (ICD E66) This taxonomy refers to International Classification of Diseases (ICD) -see [2]-. is one of the diagnoses identified at the time of hospitalisation. Until 2018 it was possible to classify obesity according to 3 classes (class I, II and III). Since 2019 two new categories, specifically for patients aged within the 3–17 range, have been added. Furthermore, since 2022 it has also been possible to separate class III obesity into three sub-categories, allowing for a more precise classification of the diagnosis of obesity. Please refer to T1 for a complete overview of the different classes of obesity.
Obesity classes as per the International
Classification of Diseases*T1
| Class | BMI |
|---|---|
| I | 30 < = BMI < 35 |
| II | 35 < = BMI < 40 |
| III | BMI = > 40 |
| IIIa | 40 < = BMI < 50 |
| IIIb | 50 < = BMI < 60 |
| IIIc | BMI = > 60 |
| < 18 | Obesity in patients aged 3–17** |
| < 18+ | Extreme obesity in patients aged 3–17*** |
*Classification based on ICD-10-GM 2022 version.
**97th perc. < = BMI < = 99.5th perc.
***BMI > 99.5th perc.
Source: FSO – International Statistical Classification of Diseases (CIM-10-GM 2022)
© FSO 2023
Obesity-related hospitalisations, obesity types and classes: an overview
Hospitalisations with obesity as the main diagnosis Each hospitalised case is associated with a certain number of diagnoses. The main diagnosis is defined as “the status established as the diagnosis at the end of the hospital stay, which was the main reason for the treatment and checks on the patient” (source: Medical Coding Handbook, FSO). show a stable trend for the period 2012–2022. For instance, in 2022 0.32% (4738 cases) of the cases had obesity as their main diagnosis (see Figure G1).
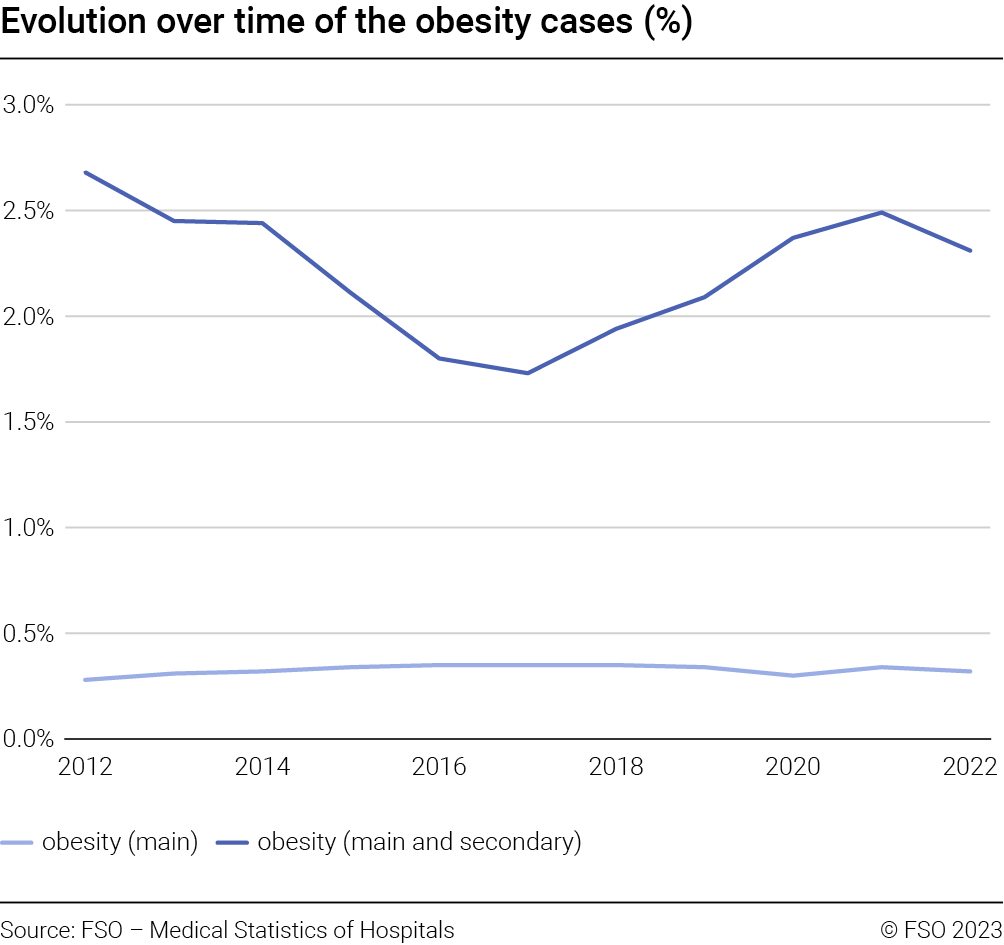
It is worth noting that the hospitalisations with obesity as a main or secondary diagnosis show a U-shape pattern which is fully driven by the behaviour of obesity cases which are unspeci-
fied (please find further evidence regarding this point in Appendix B.1). The cases with obesity used for the analysis performed in this study, refer to those where obesity is defined as main or secondary diagnosis.
Obesity cases can be classified according to the type. More precisely, following [2] four main types can be identified: obesity due to excess calories; medication-induced obesity; extreme obesity with alveolar hypoventilation; other form of obesities; plus an additional category referring to unspecified types.
In Figure G2 (left) the relative contribution of each type category over time is reported. In 2022 for almost 50% of the obesity-related hospitalisations the type is unspecified, while for instance in 16.7% of the cases the obesity is due to excess calories or drugs. Please note that these two categories have been grouped together as drug-related cases are marginal over the entire period.
On the one hand, after a period of three years showing an increasing trend, unspecified cases stabilised at around 50%. On the other hand, cases related to excess calories, drugs or with alveolar hypo-ventilation decreased in relative terms.
The reasons for the observed pattern could be related to how diagnoses are attributed to a given case depending on the precision of the information available.
Obesity cases can be classified also based on the classes (T1). In Figure G2 (right) the relative contribution of the different obesity classes over time is reported. As already mentioned above, since 2022, it has also been possible to separate class III obesity into three sub-categories. For comparability reasons, and to ensure a better understanding of Figure G2 (right), for 2022 only the aggregate value for class III obesity has been reported. Please note that cases where the BMI is between 40 and 50 represent 23.4% of the total obesity hospitalisations, those with a BMI of between 50 and 60 and a BMI greater than 60 3.9% and 1.3% respectively. For instance, in 2022, class I obesity represents 32% of the total number of obesity-related hospitalisations. Over time, an increase in class II and class III obesity and a contemporaneous decrease in class I has been observed. This means that over time the class of obesity refers to the severest form of this pathology. The decrease in unknown cases could be attributed to an improvement in information and the coding practices available. Furthermore, it should also be noted that there was a structural break between 2019 and 2020 (increase by about 4 percentage points of obesity cases class I) which could be related to the COVID-19 pandemic. Finally, the share of obesity-related (normal and extreme) hospitalisations involving younger patients aged between 3 and 17, something that has only been monitored from 2019 onwards, accounts for around 1% of the total cases.

Obesity, patients’ socio-demographic features
This study exploits information from the Medical Statistics of Hospitals (MS), a comprehensive and mandatory data collection from the FSO. The statistics reported in this document refer to the hospitalised population (persons who have been hospitalised and discharged, transferred to another hospital or deceased). Data span the period from 2012 to 2022. Most of the analysis has been performed using cases instead of patients: therefore a person who in a given year is hospitalised and discharged N times is counted consequently. If a different counting unit is used, this is specified. For the hospitalised population, the following socio-demographic information has been used: gender, age, nationality, canton of residence. This information has been supplemented by the clinical information for the given case such as the related diagnoses, treatments, duration, status on exit, among others.
Based on the above, it follows that results referring to the socio-demographic features of patients hospitalised and discharged with obesity as a diagnosis, documented in this report, should be compared with caution to those reported in the “Swiss Health Survey” [6] as the reference population of the two studies is different (hospitalised population in Switzerland vs the Swiss resident population).
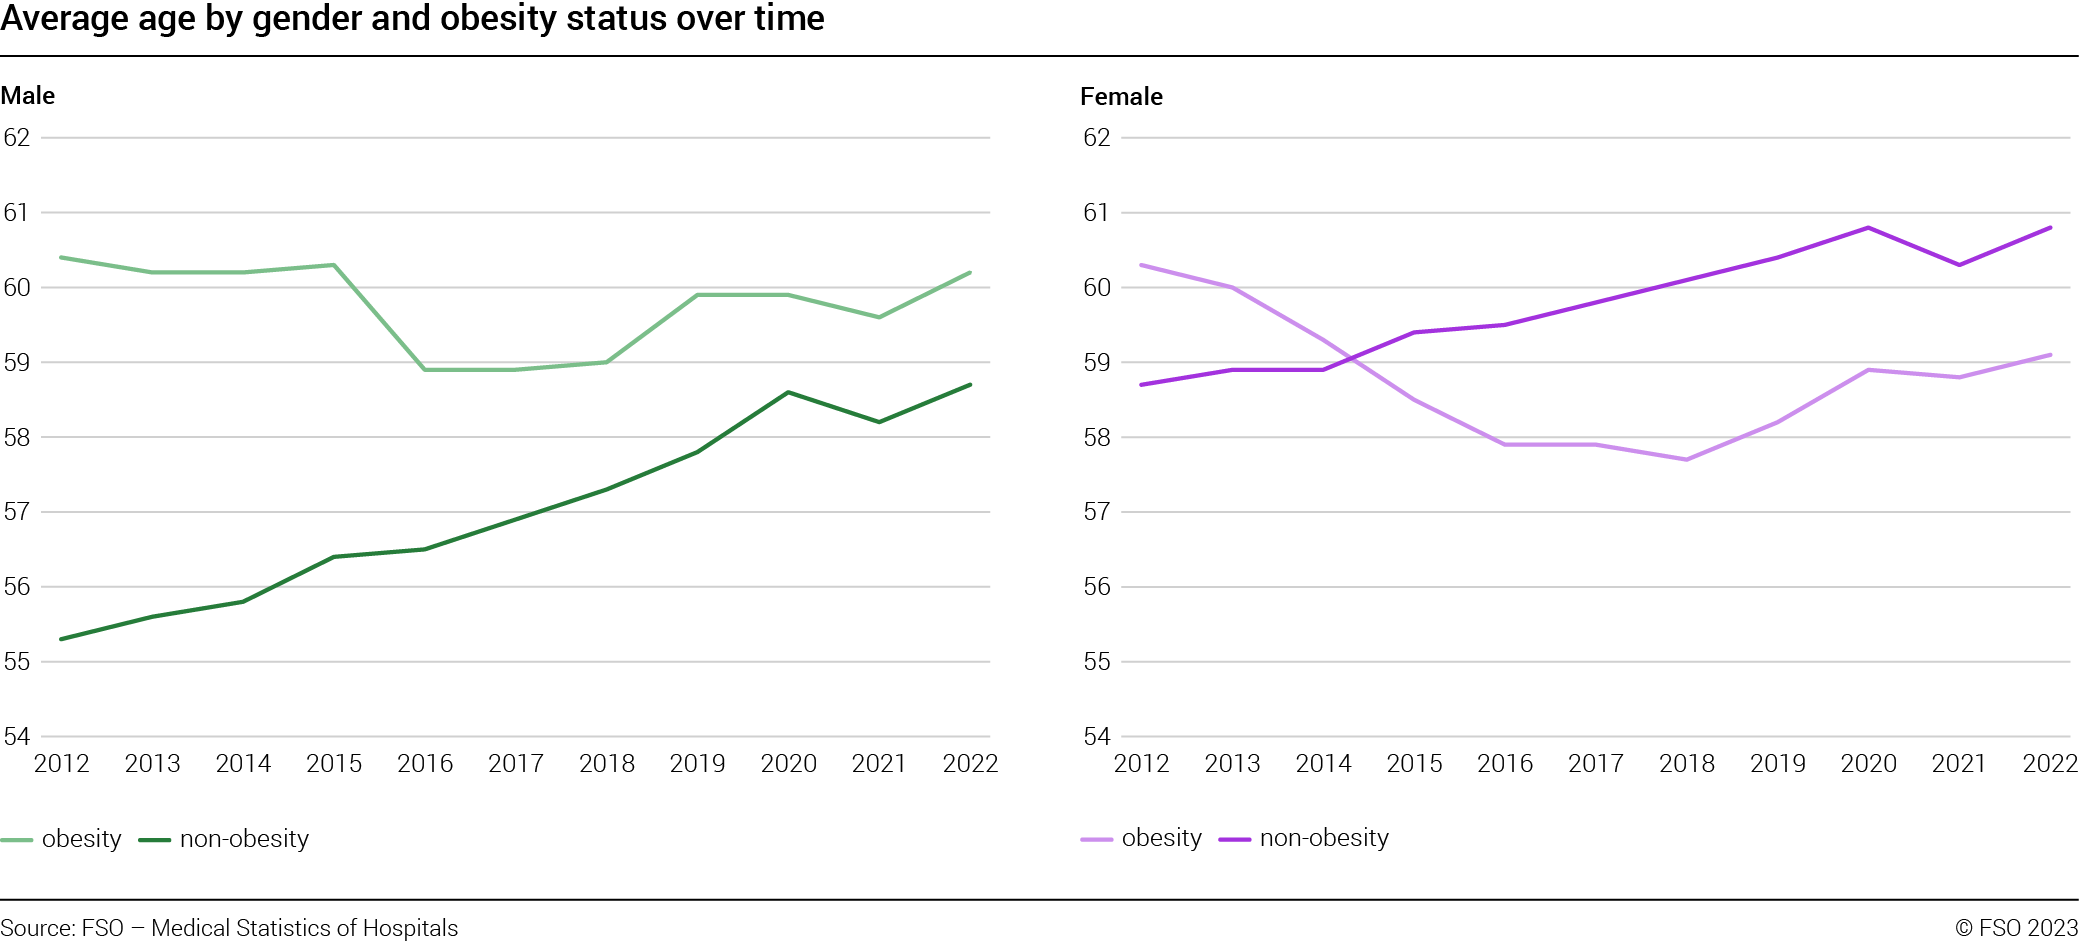
In Figure G3 the evolution over time of the average age distinguishing between obesity-related and non-obesity related hospitalisations is reported: For comparability reasons, cases related to new-borns in healthy conditions, and cases with diagnoses new born or pregnancy related have been dropped. excluding the period 2012–2015, where the average age for obesity cases is materially higher than that for non-obesity cases, no major differences are observed.

The analysis is repeated in Figure G4 by distinguishing the hospitalisations by gender. Interestingly, the two sub-groups follow different patterns: on the one hand, for male cases (Figure G4, left) a material difference in the average age between obesity and non-obesity groups is observed, with the former systematically older than the latter. For the female cases (Figure G4, right), the analysis is less straightforward. However, for the period 2015–2022, it is observed that non-obesity cases concern on average older persons than obesity cases. Finally, it is worth noting that the average age for obesity cases is not materially different between males and females, while a difference is observed for the non-obesity counterparts.
In Figure G5 (left) for 2022, the distribution of the hospitalisations by age cohorts is reported distinguishing between obesity and non-obesity cases (please refer to footnote 6 regarding the fine-tuning process applied to minimise bias between the two groups). For instance, in 2022, it is interesting to note that, in relative terms, obesity cases “dominate” the age cohorts from 25–34 to 65–74. Furthermore, approximately 43% of the obesity cases are concentrated in the age cohorts 55–64 and 65–74. This is not surprising, as it is known that obesity is a pathology affecting, above all, the older population.
Taking a long-term perspective, we can compare the 2012 and 2022 results for obesity hospitalisations to assess how the distribution of the cases evolves over time. As reported in Figure G5 (right), over time a thickening of the distribution tails is observed, meaning that in 2022, for the age cohorts from 0–15 to 35–44 and 85+ age cohort, in relative terms, obesity as a diagnosis among the hospitalised population is more likely than in 2012. Or, in other words, if for instance, in 2012 per 100 cases 4.74 belonged to the age cohort 25–34, this share in 2022 jumped to 6.67.

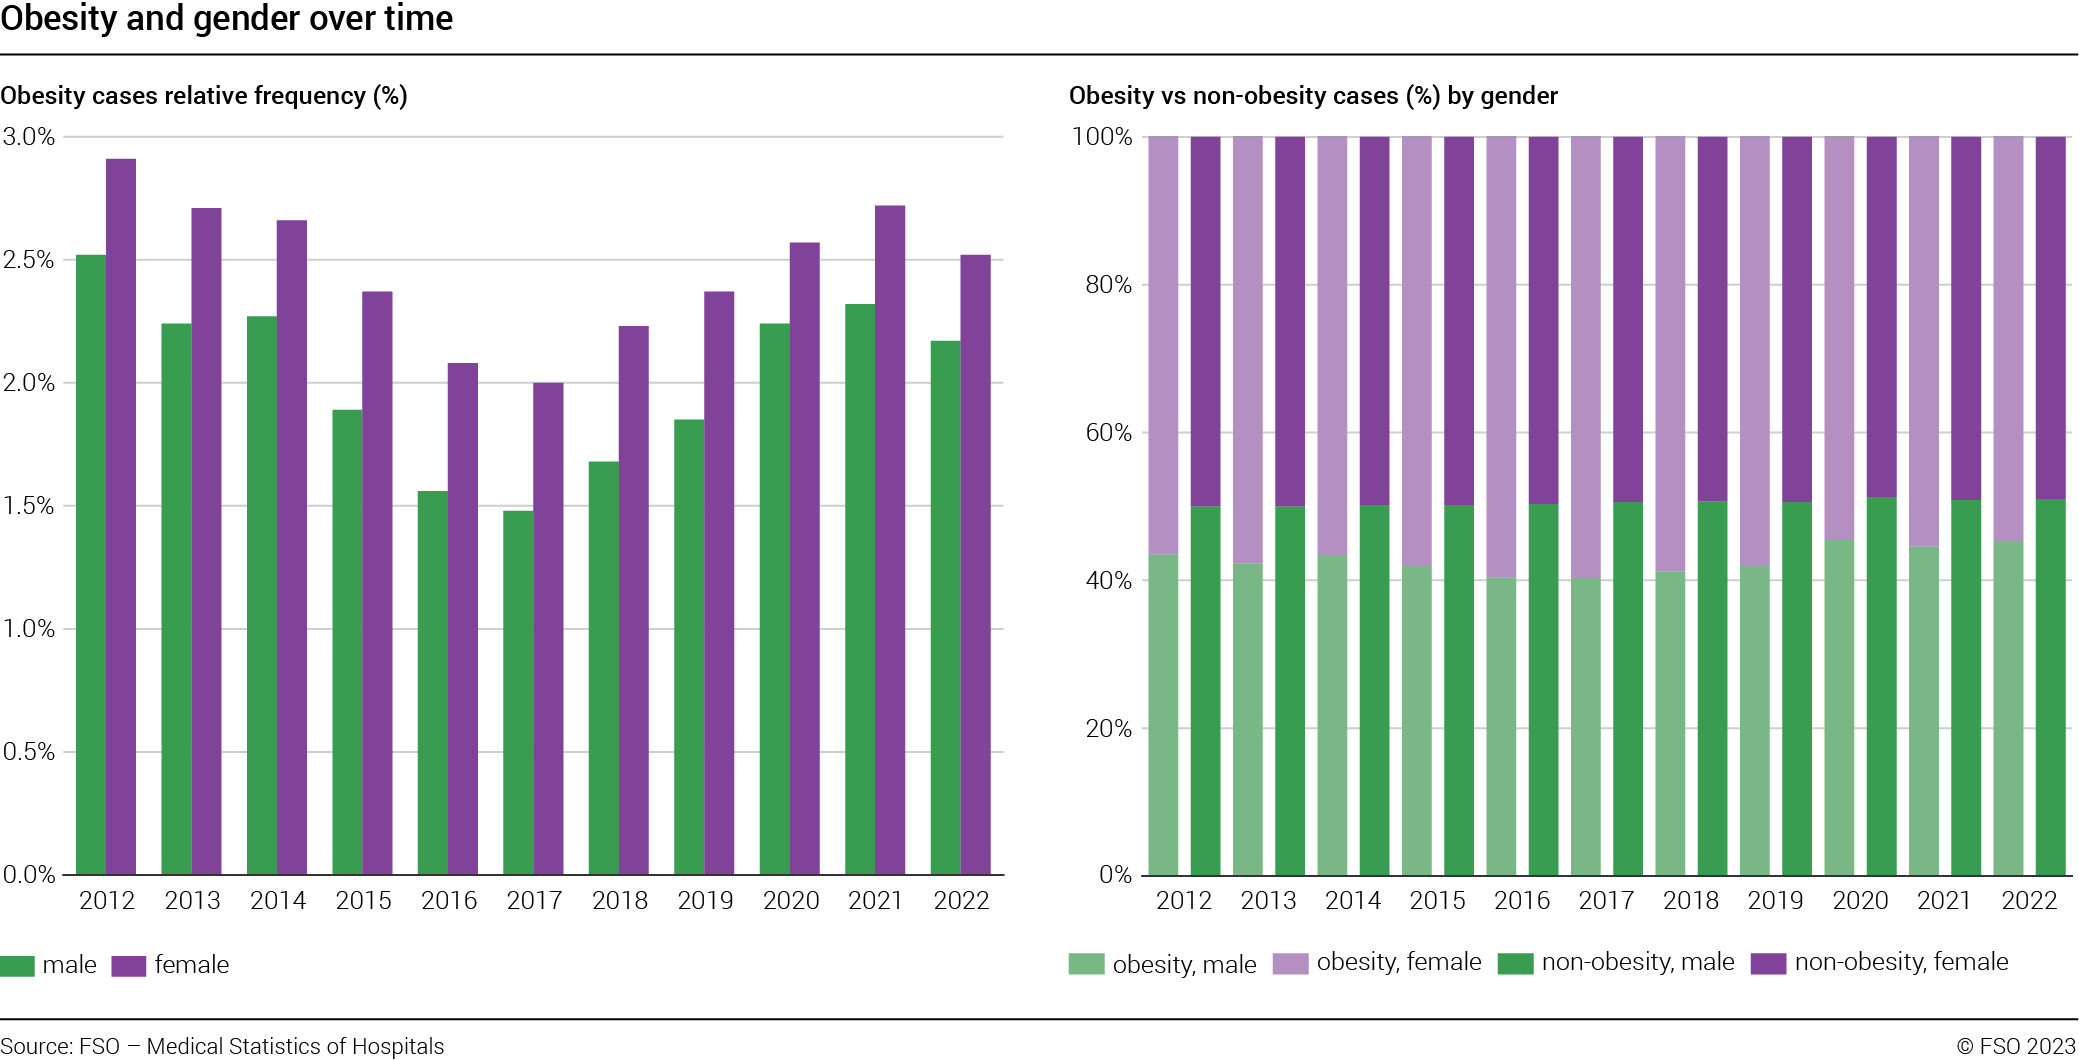
Figure G6 (left) reports the frequency of obesity-related hospitalisations by gender: Please note that the observed U-shape is due to unspecified obesity cases, as discussed above. in 2022, among female cases, per 100 hospitalisations, 2.5 were obesity-related. In the same year, the rate for male cases was approximately 2.2. Over the entire sample period, obesity cases were more frequent (in relative terms) among females.
Figure G6 (right) compares instead the distribution of hospitalisations by gender over time distinguishing between obesity and non-obesity cases. Please note that in order to minimise potential bias across groups, we applied the data cleansing process as described in footnote 6. For instance, in 2022, of 100 obesity cases 46.3 referred to males and 54.7 to females. For non-obesity related hospitalisations this figure was 51 and 49 for male and female cases, respectively. This result suggests that there is an “obesity” effect: we observe a larger proportion of female cases among the obesity-related hospitalisations than among non-obesity related ones. This pattern is observed throughout the entire sample period. Interestingly, obesity-related male cases jumped from 42.1% to 45.6% during the period 2019–2020. This pattern is not observed for the non-obesity counterpart.
Obesity, nationality, and urban-rural areas
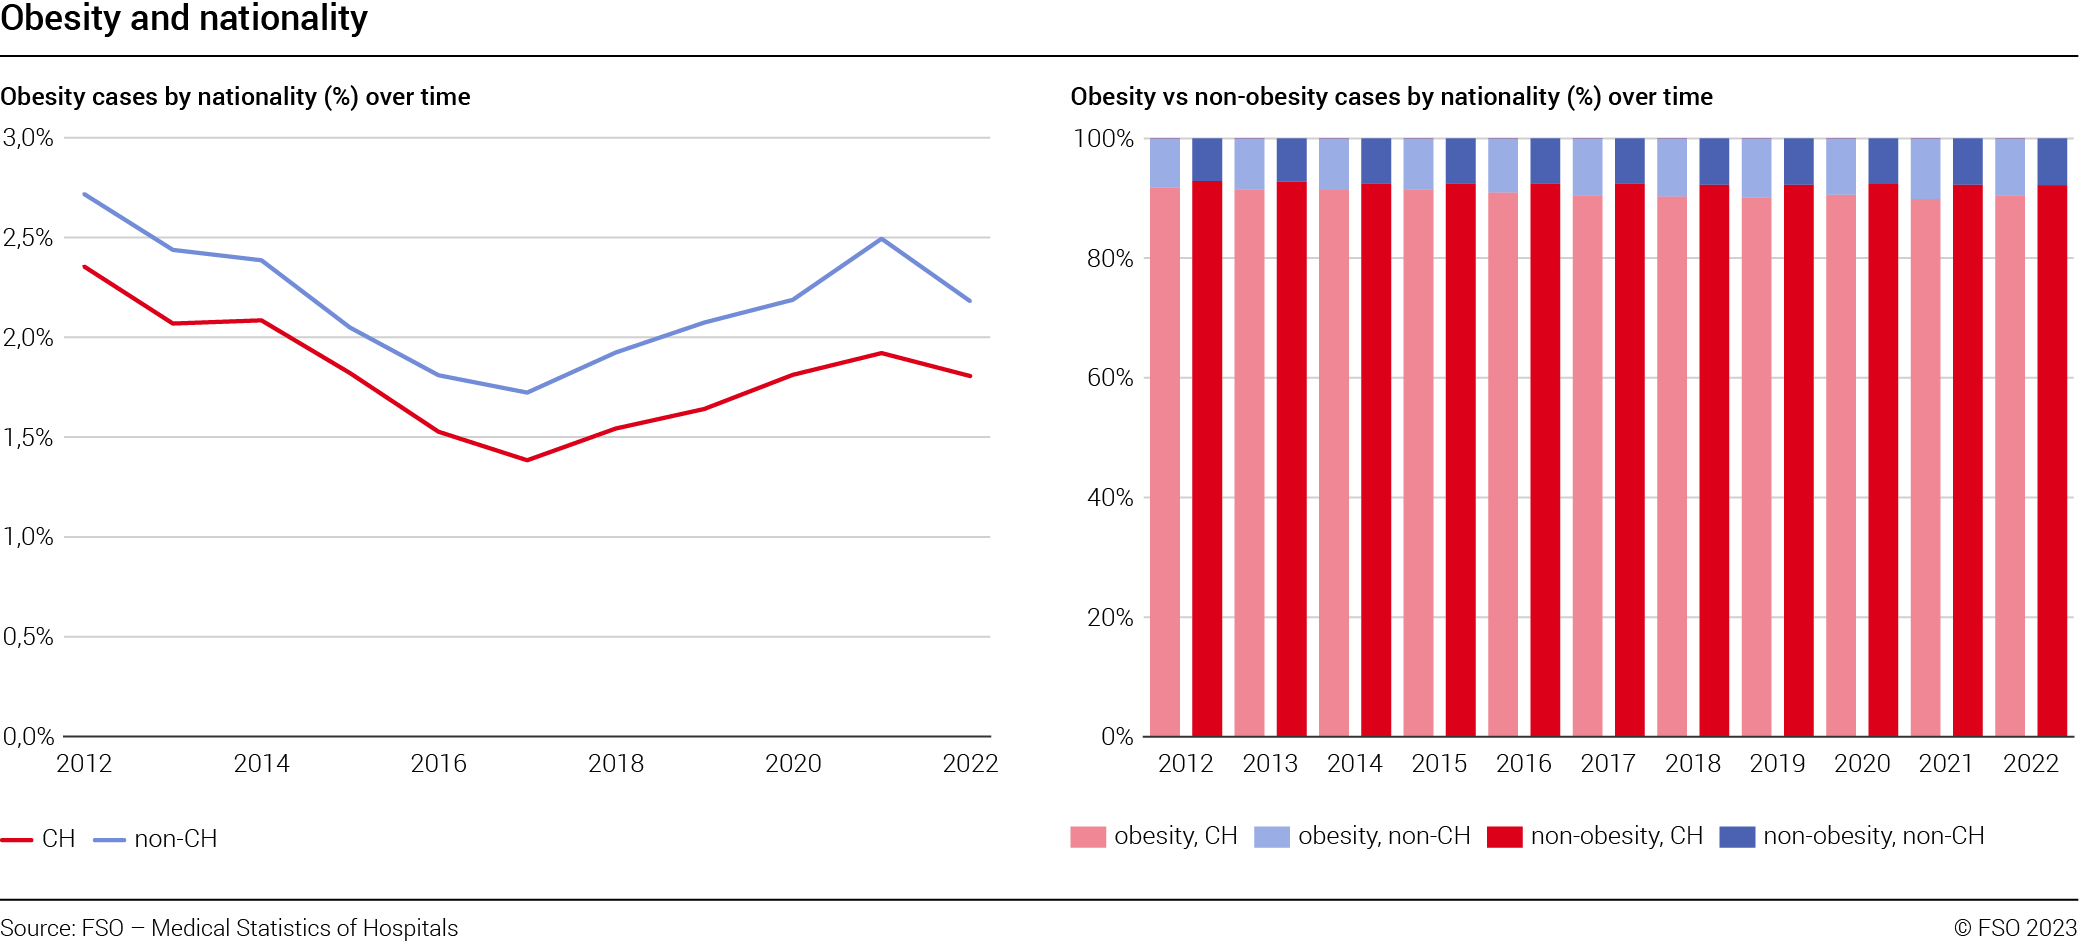
Some studies ([3] and [4]) based on obesity in schoolchildren in Switzerland found that obesity is correlated to the nationality of the parents, suggesting that origins matter (see also [5] and [6] for further evidence). In Figure G7 (left) we report the relative frequencies of obesity-related hospitalisations distinguishing patients by nationality (Swiss vs non-Swiss). Please note that this analysis is based on patients and not on cases. Patients with more than one hospitalisation in a given year and a non-constant obesity status have been excluded. Furthermore, please also note that observations for which nationality was unknown or was not the same within a given year (for patients with more than one hospitalisation) have been excluded. The same is true for people living abroad receiving health care in Switzerland. Finally, please note that in order to minimise potential bias, cases with pregnancy-related diagnoses have been excluded. Evidence confirms the results in [6] (using data on the Swiss population) and studies on schoolchildren: it is more frequent for a non-Swiss patient to have obesity as a diagnosis than a Swiss one. This is true for the entire period analysed. For instance, in 2022, 2.2% of the non Swiss hospitalised patients had obesity as diagnostic. This share decreased to 1.8% for Swiss patients. Please also note that the U-shape curve, as explained above, is due to the unspecified cases. Results are unchanged when controlling for patients age (younger than 50 vs older than 50, evidence not reported due to space limitations).
Figure G7 (right) compares the distribution of patients by nationality (Swiss vs non-Swiss) over time distinguishing between obesity-related vs non-obesity related hospitalisations. For instance, in 2022 90.5% of obese patients had a Swiss passport, while for non-obese patients, this share was 92.2%. Therefore, Swiss patients are thus more frequent (in relative terms) among non-obesity hospitalisations than among obesity-related ones.
The figures are essentially stable over time: hospitalisations for non-Swiss patients with a diagnosis of obesity always show higher frequency than their counterparts without obesity as a diagnosis. The difference increases over time: while in 2012 it was slightly above 1.2 percentage points, in 2022 the share was 1.7 percentage points greater.
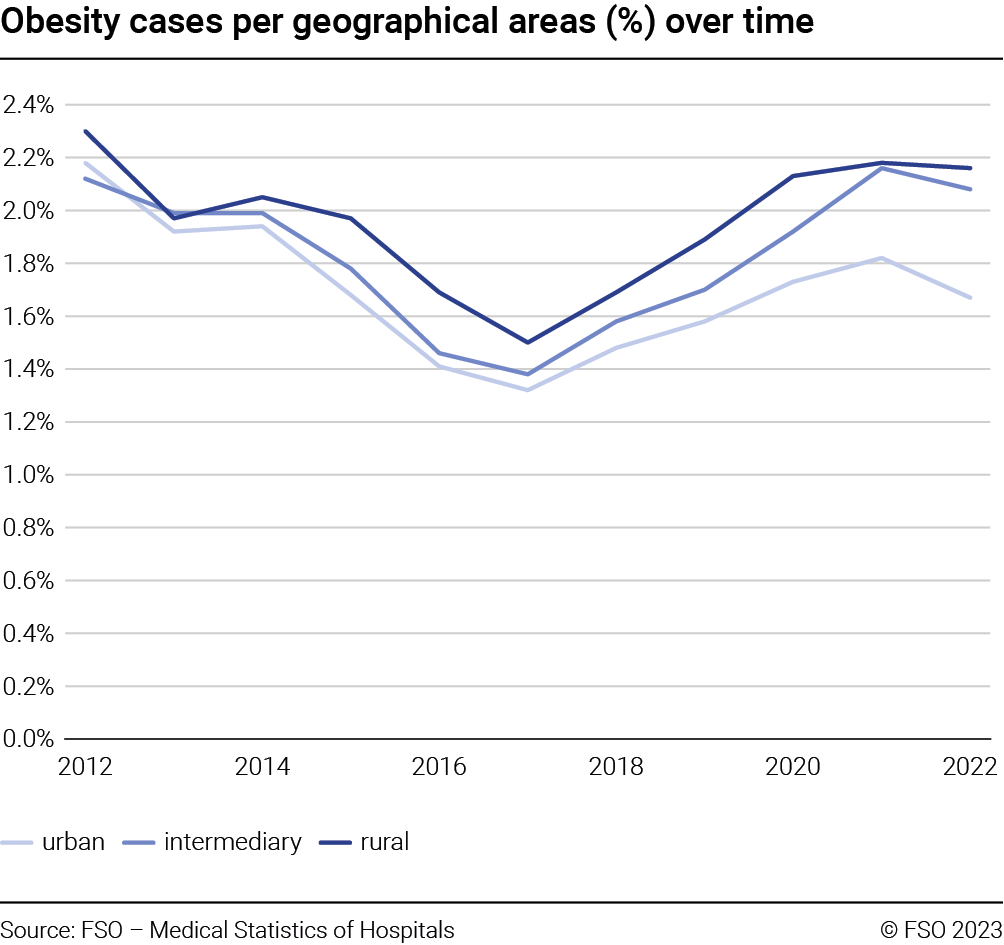
Still focusing on patients, in Figure G8 the frequency of obesity-related hospitalisations over geographical areas (rural, intermediary, urban) and over time is reported. Please note that when information on the canton of residence canton is missing or when a patient has their domicile abroad then the entry has been excluded. Furthermore, as regions could be subject to reclassification from one area to the other, we fix this potential source of variability using the regions’ classification as per 2022, and applying it backward to the entire sample period. Finally, each region could have different sub-regions that can be potentially classified in different areas (urban, rural, intermediary). Therefore, a given region has been attributed to a given area based on the highest population number per area in that region. The patterns of the series show the already known U-shape which is driven by unspecified obesity-cases (evidence not reported).
Results suggest that the share of obese patients living in rural or intermediary areas is constantly higher than the share of those living in urban areas. As an example, in 2022, 1.67% of the patients living in urban areas suffered from obesity. This value increased to 2.08 and 2.16 for patients living in intermediary and rural areas. These results are consistent with [6] and [7].
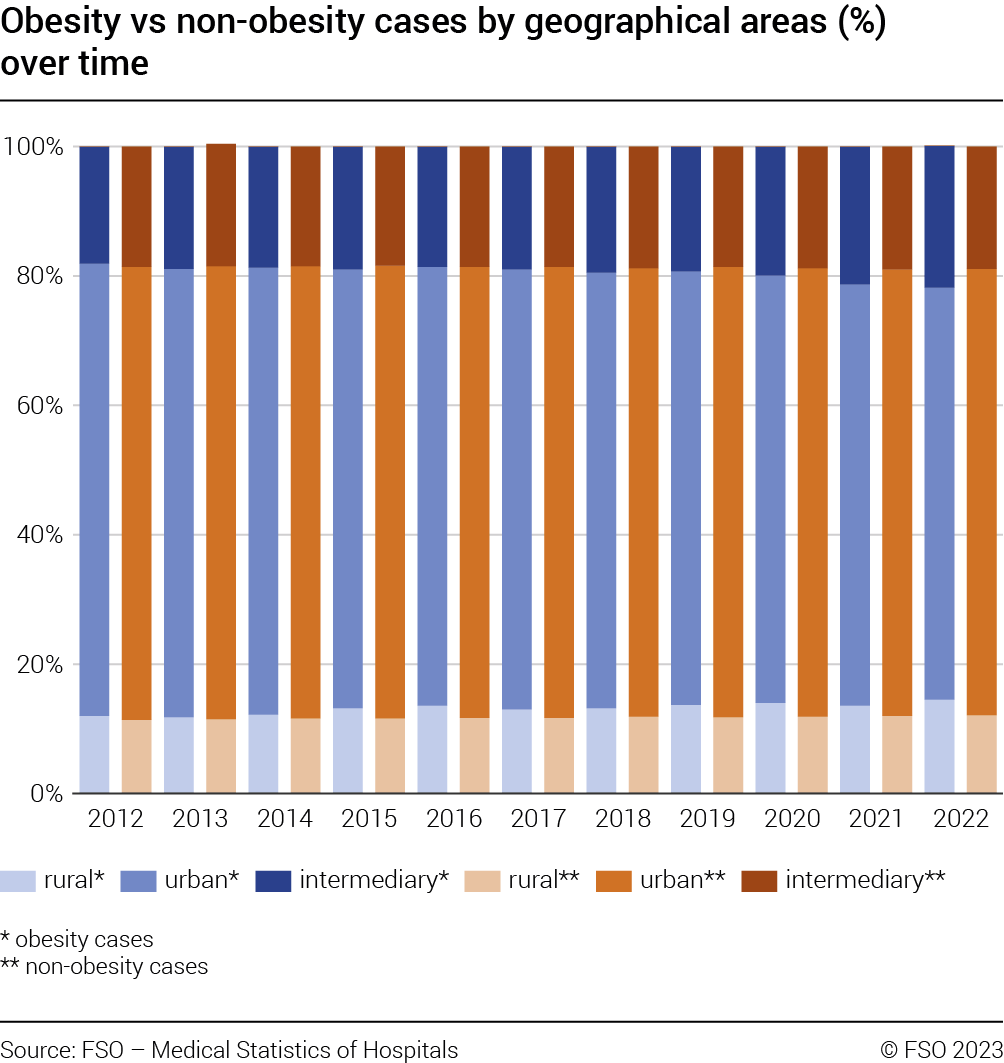
In Figure G9 the distribution of patients over geographical areas is documented (rural, intermediary, urban) distinguishing between obesity-related vs non-obesity related hospitalisations. For instance, in 2022 63.7% of obese patients lived in urban areas. The figure for non-obese patients was 69%. Consequently, non obese hospitalised patients living in urban areas were relatively more frequent than those living in the same areas but suffering from obesity. The opposite is true for patients living in rural or intermediary areas.
In order to avoid potential bias due to specific social features, we performed robustness checks by repeating the analysis distinguishing the hospitalised discharged population between those aged under 50 or aged 50 or over. Results (not reported due to space limitations) show that the patterns observed in Figures G8 and G9 are similar to those when the sample is restricted to patients aged 50 or over. Differences across geographical areas are smoothed when focusing on patients younger than 50. This means that what is observed is at least partly driven by an age effect more than a geographical pattern.
Obesity, co-morbidity, (main) diagnosis
and (main) treatment
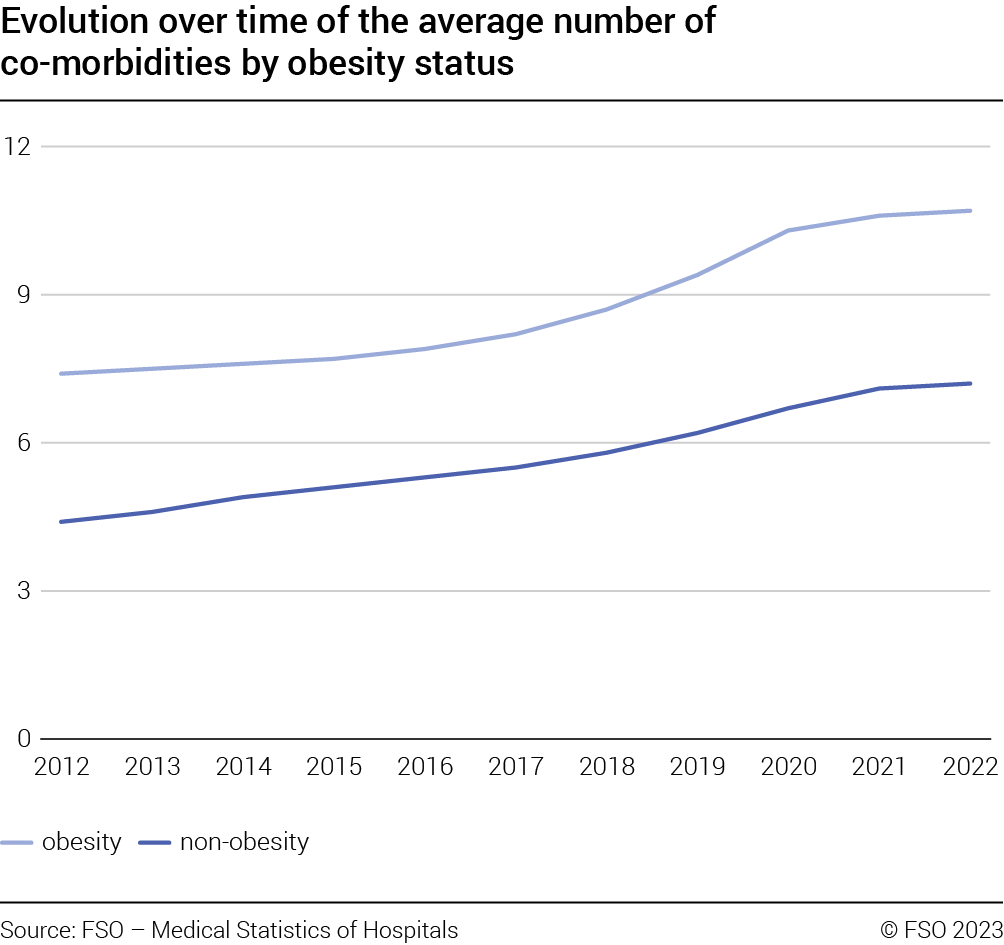
Figure G10 reports the evolution over time of the average number of diagnoses associated with a given case distinguishing between obesity-related and non-obesity related hospitalisations. Data cleanse follows footnote 6. At the same time, it impacts only marginally the results. Please note that in this study, co-morbidity refers to the number of diagnoses associated with a hospitalisation, regardless of (a) the nature of the health condition, (b) the relative importance of the co-occurring conditions and (c) the chronology of presentation of the conditions. On average, obesity cases are associated with a higher number of diagnoses than their counterpart (10.7 vs 7.2 diagnoses in 2022).
The difference in the average number of diagnoses between obesity and non-obesity cases increases over time. This evidence is confirmed when the median is used. Finally, without distinguishing between obesity-related vs non-obesity related hospitalisations, it is noted that the average number of co-morbidities constantly increases over time. This trend may reflect the changes in the codification system of pathologies.
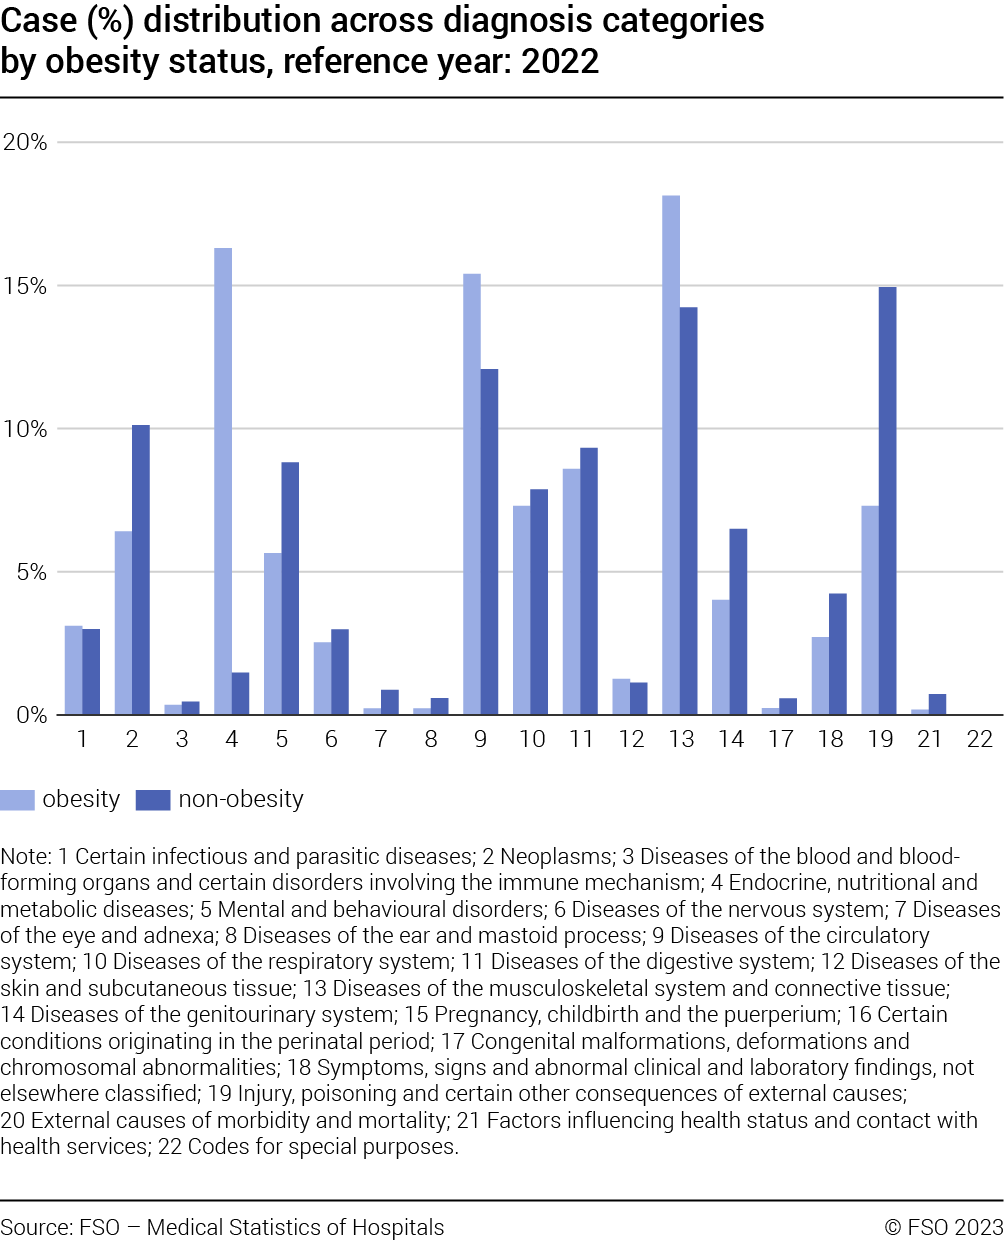
Based on 2022 data, in Figure G11, hospitalisations have been classified based on their main diagnosis. Data cleanse follows footnote 6. At the same time, it impacts only marginally the results. Diagnosis can be classified in 22 broad categories. A complete overview of all categories is documented in T2 in the Appendix. Relative frequencies are reported for obesity-related and non-obesity related cases. Not surprisingly, the results show an obesity-effect: obesity cases are associated with specific diagnoses categories. In particular, more than 45% of the obesity cases are concentrated in the following categories: “Diseases of the musculoskeletal system and connective tissue” (18.1%), “Endocrine, nutritional and metabolic diseases” (16.3%) and “Diseases of the circulatory system” (15.4%). These are also the categories where the difference between obesity and non-obesity cases is more material. Focusing on obesity flagged cases, and using an intermediary level of the ICD classification, if obesity-related diagnoses are disregarded, it follows that “Arthrosis” (3067), “Other forms of cardiac disease” (2202) and “Ischemic heart disease” (1214) are the top-three most frequent main diagnoses.
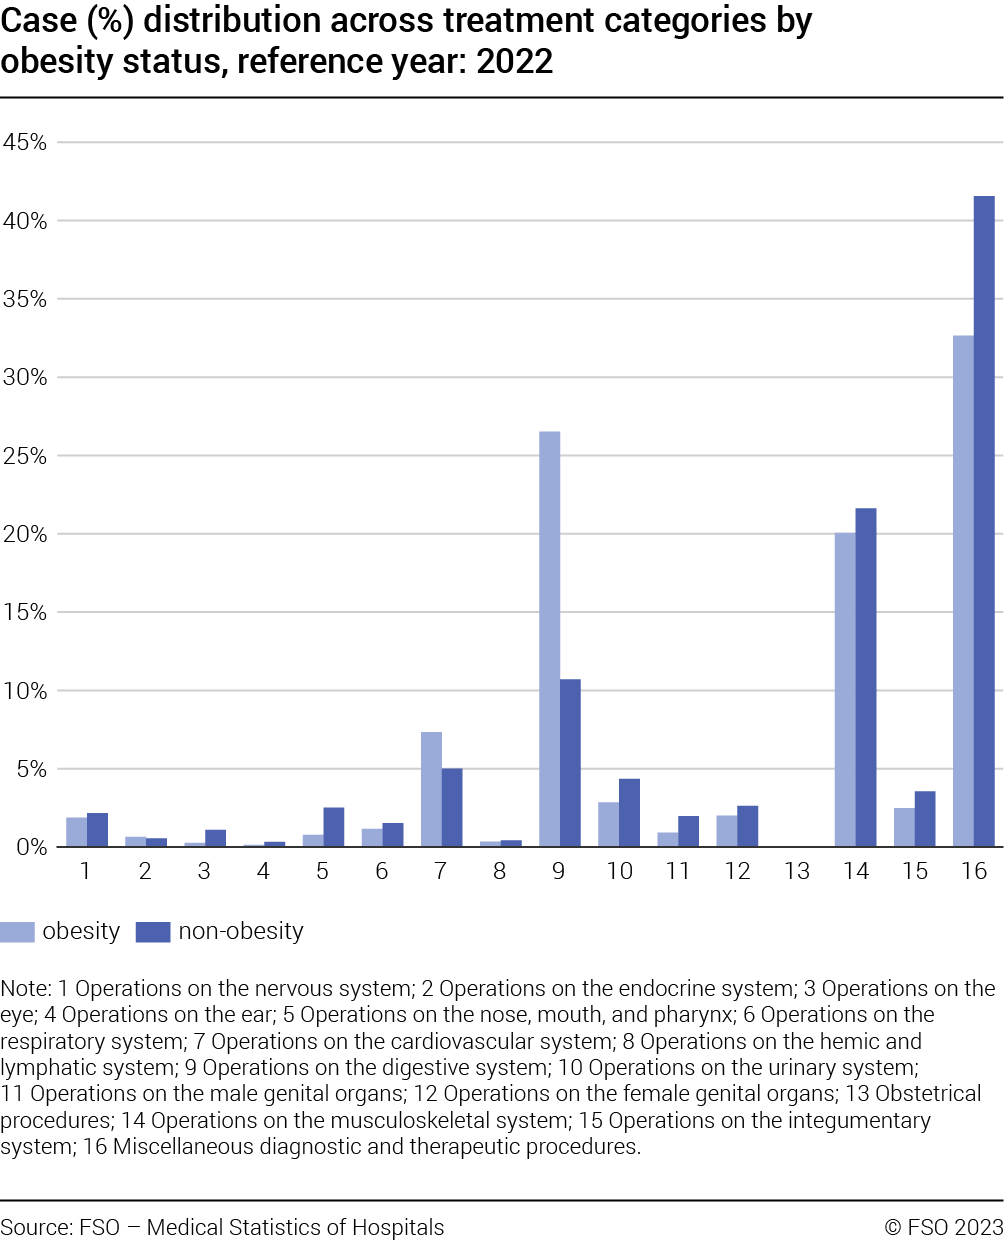
Finally, in Figure G12 cases have been classified according to their main treatment, distinguishing between obesity-related and non-obesity related hospitalisations and applying the same cleansing process as described in footnote 6.
Treatments can be classified in 16 broad categories. A complete overview of all categories is documented in T3 in the Appendix.
Results for 2022 show that, when disregarding category “Miscellaneous diagnostic and therapeutic procedures”, obesity cases are mainly concentrated in specific treatment categories: “Operations on the digestive system” (26.5%) and “Operations on the muscular-skele-
tal system” (20.1%).
Obesity, hospitalisation duration
and fatality events
Figure G13 reports the average hospitalisation duration distinguishing between obesity-related and non-obesity related hospitalisations over time. Results show that obesity cases are on average associated with a longer duration. This is a pattern that strengthens over time, despite a decrease in duration being observed for both groups. For instance, in 2012 an obesity case was on average 1.9 days longer than a non-obesity case. In 2022 this difference is 2.2 days.
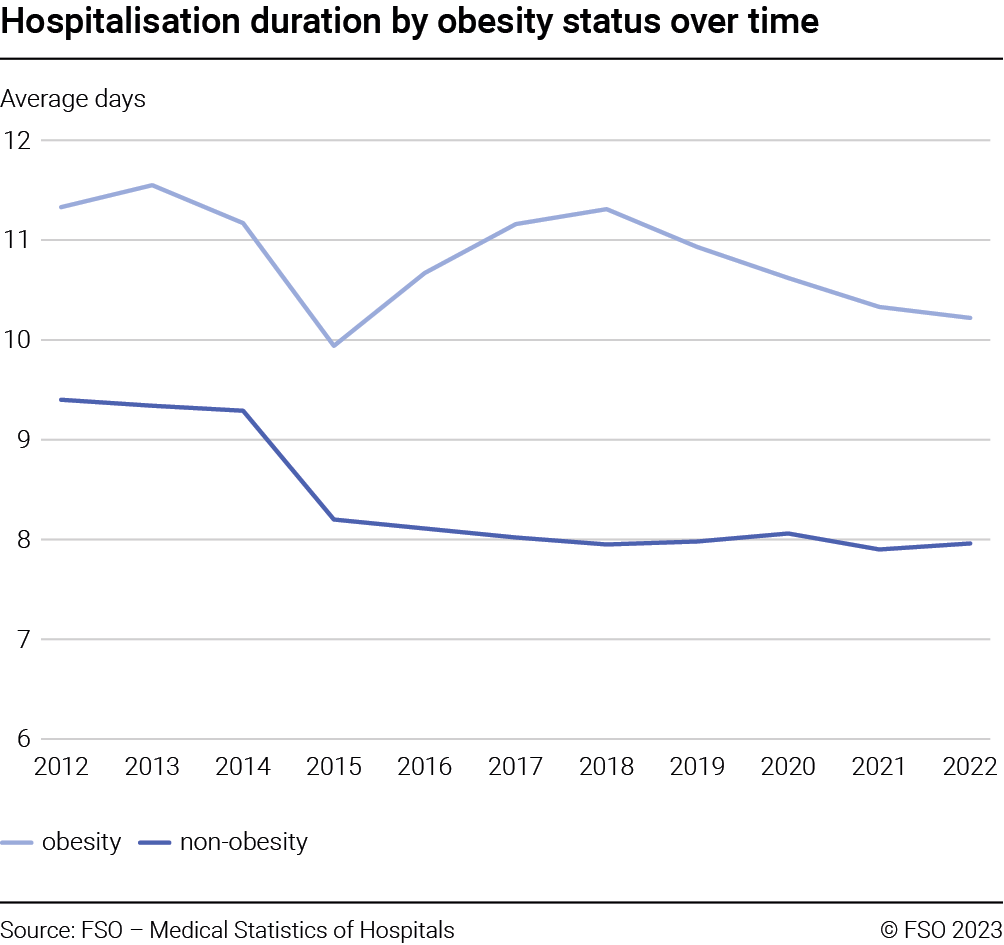
Figure G14 (left) reports the fatality event frequency for obesity-related and non-obesity related hospitalisations Please note that to calculate the fatality event frequency we focus on patients. over time. For instance, among obesity cases in 2022, a fatality event occurred in 1.5% of cases. For non-obesity cases in the same year the event is observed 2.7% of the times. It follows that a fatality event is less frequent among obesity-related patients. This is true for the entire sample period studied. For both groups a material structural break between 2019 and 2020 most likely related to the COVID-19 pandemic was observed: fatality events increased between 0.4 and 0.5 percentage point for non-obesity and obesity cases, respectively.
Figure G14 (right) displays the evolution of fatality events among obesity-related hospitalisations by gender (also in this case we focus on patients and not on cases). In 2022, the fatality event frequency is 1.7% for male obesity cases. For females, the percentage remained below this level (1.4%). Furthermore, combining this evidence with evidence reported in Figure G6 (left)results in an interesting pattern: while obesity cases are more likely among females, at the same time, fatality events among obesity cases are more frequent for male hospitalised patients. Interestingly, also in this case, it is worthwhile noting the variation observed between 2019 and 2020: for females a 0.4 percentage points increase is observed. This change equals 0.6 percentage points increase for males.

For the year 2022, the relative frequency of fatality events is reported over age cohorts distinguishing between obesity-related and non-obesity related, male and female hospitalisations is shown in Figure G15 (left) and Figure G15 (right), respectively. Focusing on obesity cases, 75,4% of the fatalities occur among males aged 65–74 or older, while for the same age cohorts, it is observed 79,1% of fatalities occurring among females. Combining this evidence (fatality among male cases occurs earlier) with that in Figure G4 (left) (male cases with obesity as a diagnosis are older than their female counter-parts) it follows that the higher fatality rate for males with obesity as a diagnosis seems not be driven by age.

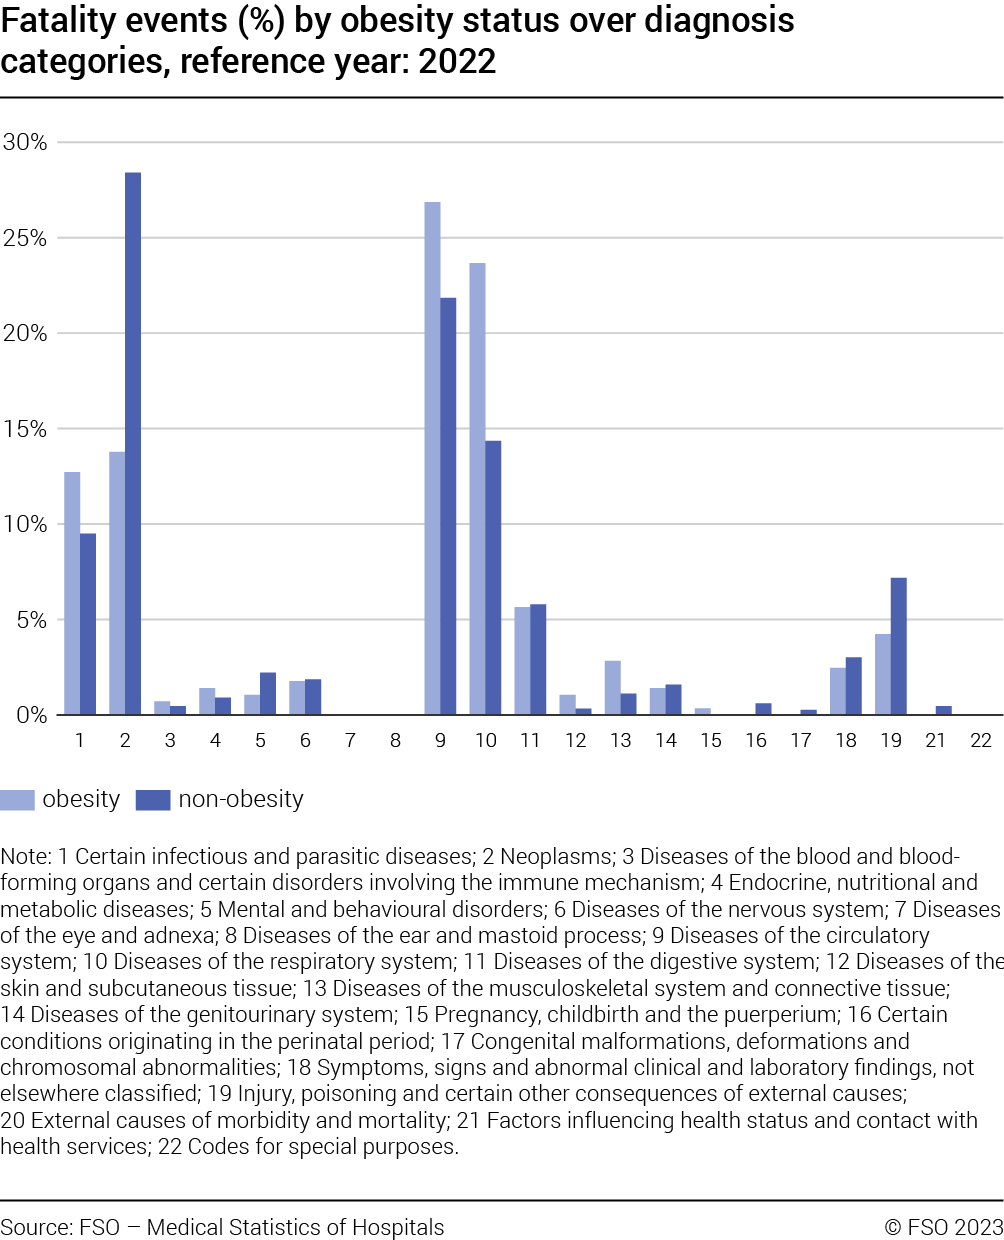
Finally, Figure G16 reports the distribution of mortality cases across (main) diagnosis categories (see T2 for the exhaustive list of categories) distinguishing between obesity-related and non-obesity related hospitalisations. For instance, in 2022, 13.8% of the fatalities related to obesity cases concerned hospitalisations with a main diagnosis of “Neoplasms”. The fatality share for non-obesity related cases during the same year and the same cate-gory was 28.4%. For 2022, “Diseases of the respiratory system” and “Diseases of the circulatory system” were the two categories in which mortality among obesity cases was mainly concentrated.
Econometric analysis
In this section, a quantitative analysis is performed focusing on obesity and fatality event and obesity and hospitalisation duration.
Obesity and fatality event
The impact of obesity on fatality events is assessed estimating the following regression:
fatality = α + β1 × obesity + β2 × age + β3 × gender + Θ × X + єϵ (1)
where fatality takes value 1 if the fatality event occurs and 0 otherwise, α is a constant term, obesity is a binary variable that equals 1 when the case is obesity-related and 0 otherwise, age refers to the age at the time of the hospital admission while gender takes value 1 if male and 2 otherwise. Finally, X represents a set of controls referring to diagnosis categories and hospitals fixed effects. A case is defined as obesity-related if at least one of the related diagnoses refers to obesity. For diagnosis categories please refer to T2. Estimations are based on a logistic model, standard errors are hospital-clustered.
Column (1) in T4 reports 2022 outcome for the full model controlling for diagnoses categories and hospitals. Having obesity as a diagnosis reduces fatality event by approximately 22%, age increases the likelihood of fatality event by more than 5% for each additional year, while being female decreases the likelihood of fatality event by about 26%. These findings are consistent with those in [8], [9] and [10]. Results are robust to additional explanatory variables such as the square of the age, reflecting the fact that the impact of age on the dependent variable increases with increasing age.
Moreover, columns (2) and (3) display the results when distinguishing cases based on the number of diagnoses (up to 4 vs 5 or more). Results suggest that when the number of diagnoses are below 5, obesity reduces a fatality event by more than 90%, These results are likely to be driven by the few cases of the combination of fatality event / obesity with a number of diagnoses smaller than 5. while when this number is equal to or larger than 5, in the case of obesity, a decrease in fatality event only of about 35% is observed.
In column (4) to (6), for hospitalisations with the (main) diagnosis category “Diseases of the musculoskeletal system and connective tissue” the results are reported by distinguishing between three cases: all hospitalisations (not controlling for the number of diagnoses); cases with 2 or for more diagnoses; cases with 10 or more diagnoses. When the number of diagnoses is not taken into account, obesity increases the likelihood of a fatality event by 1.36 times. This impact is statistically significant. When distinguishing between the number of co-morbidities the impact is still significant for cases with 2 or more diagnoses (the likelihood of a fatality event increases by 1.2 times), while the effect is no longer significant when estimating the model only for hospitalisations with more than 10 diagnoses. Results related to other diagnosis categories (not reported) show heterogeneous results: in the majority of cases obesity decreases the likelihood of a fatality event, but only in some cases is the coefficient statistically significant.
Finally in column (7) to (9) results for the full model referring to 2019, 2020 and 2021 are presented, controlling for diagnosis categories and hospitals. In all the cases, obesity decreases the fatality event likelihood (the impact is included between 10% and 17%). However, only for 2019 and 2020 the coefficient is statistically significant.
In a nutshell, obesity is a risk factor contributing to an increased likelihood of a fatality event only when patients suffer from specific pathologies. When the number of co-morbidities is taken into account, the impact of obesity on observing a fatality event is usually mitigated. This can be due to the over-adjustment feature of the co-morbidity explanatory variable as explained in [11].
Obesity and hospitalisation duration
Using 2022 data, the impact of obesity on hospitalisation duration is assessed estimating the following specification:
duration = α + β1 × obesity + β2 × age + β3 × gender + Θ × X + є ϵ (2)
where duration refers to the number of hospitalisation days for a given case. Parameter α is a constant term, obesity is a binary variable that equals 1 when the case is obesity-related and 0 otherwise, age refers to the age at the time of the hospital admission while gender takes value 1 if male and 2 otherwise. Finally, X represents a set of additional controls such as hospitals fixed effects or diagnosis categories, depending on the case. The specification has been estimated by means of a parametric model, assuming that the survival function follows an exponential distribution. Please note that results are robust to relaxing this assumption (using a semi-parametric approach). Standard errors are hospital-clustered.
Results are reported in T5 and T6. Hazard ratios are reported. Hazard ratios should be interpreted as the probability that an individual who is under observation at a time t has an event at that time. In our case, the event is represented by the end of the hospitalisation period. Therefore, a hazard ratio smaller than one means that the event becomes less likely, i.e., the duration gets longer. Column (0) refers to the results of the full specification including diagnosis categories and hospitals’ fixed effects as additional controls. Columns (1) to (22) refer instead to the estimations for each diagnosis category, controlling for hospitals’ fixed effects. Not surprisingly, the impact of obesity shows a certain level of heterogeneity both in the direction (in the majority of the cases suffering from obesity increases duration) and in the magnitude. For instance, ceteris paribus, without distinguishing across diagnosis categories (Tab. T5, column (0)) suffering from obesity makes the duration approximately 22.5% longer than otherwise. For the “Diseases of the respiratory system” category (Tab. T5, column (10)), the impact of suffering from obesity is even greater with a duration approximately 30% longer than the non-obesity counterpart. Our findings are aligned to those in [11] and [12].
A Appendix: Box
Body mass index (BMI)
BMI establishes a relationship between a person’s weight and height:
BMI = (weight in kg) / (height in m)2
The WHO distinguishes between different adult categories based on BMI value:
Underweight: less than 18.5 kg/m2
Normal weight: 18.5 to 24.9 kg/m2
Overweight: 25 to 29.9 kg/m2
Obese: 30 kg/m2 and over
Please note that other definitions apply to young people (under 18 years). BMI provides only an indirect estimate of body fat mass. At the individual level, the result can therefore be misleading, as BMI does not differentiate between fat and muscle mass.
B Appendix: Focus
B.1 Obesity cases U-shape
As documented in Figure G1 obesity cases show a U-shape. In this focus, we assess what is driving the observed pattern. On the one hand, the total number of hospitalisation cases show a stable pattern (evidence not reported), therefore the observed U-shape patterns depend on the behaviour of obesity cases. More precisely, obesity cases can be classified based on obesity causes. According to [2], it is possible to identify four main causes categories and an additional one referring to unspecified causes. These categories are: Obesity due to excess calories; Medication-induced obesity; Extreme obesity with alveolar hypo-ventilation; Other obesities; Obesity, unspecified As shown in Figure G17, the specified obesity cases show a moderate variability which can be attributed to the normal fluctuation of the series, while the unspecified obesity cases present the already known U-shape. As explained above, the reasons for the observed pattern for unspecified cases could be due to changes in the way diagnoses are attributed to a given case, when information is not precise.

C Appendix: Tables
Diagnosis categoriesT2
| Category code | Category name |
|---|---|
| 1 | Certain infectious and parasitic diseases |
| 2 | Neoplasms |
| 3 | Diseases of the blood and blood-forming organs and certain disorders involving the immune mechanism |
| 4 | Endocrine, nutritional and metabolic diseases |
| 5 | Mental and behavioural disorders |
| 6 | Diseases of the nervous system |
| 7 | Diseases of the eye and adnexa |
| 8 | Diseases of the ear and mastoid process |
| 9 | Diseases of the circulatory system |
| 10 | Diseases of the respiratory system |
| 11 | Diseases of the digestive system |
| 12 | Diseases of the skin and subcutaneous tissue |
| 13 | Diseases of the musculoskeletal system and connective tissue |
| 14 | Diseases of the genitourinary system |
| 15 | Pregnancy, childbirth and the puerperium |
| 16 | Certain conditions originating in the perinatal period |
| 17 | Congenital malformations, deformations and chromosomal abnormalities |
| 18 | Symptoms, signs and abnormal clinical and laboratory findings, not elsewhere classified |
| 19 | Injury, poisoning and certain other consequences of external causes |
| 20 | External causes of morbidity and mortality |
| 21 | Factors influencing health status and contact with health services |
| 22 | Codes for special purposes |
Source: FSO – International Statistical Classification of Diseases (CIM-10-GM 2022)
© FSO 2023
Treatment categoriesT3
| Category code | Category name |
|---|---|
| 1 | Operations on the nervous system |
| 2 | Operations on the endocrine system |
| 3 | Operations on the eye |
| 4 | Operations on the ear |
| 5 | Operations on the nose, mouth, and pharynx |
| 6 | Operations on the respiratory system |
| 7 | Operations on the cardiovascular system |
| 8 | Operations on the hemic and lymphatic system |
| 9 | Operations on the digestive system |
| 10 | Operations on the urinary system |
| 11 | Operations on the male genital organs |
| 12 | Operations on the female genital organs |
| 13 | Obstetrical procedures |
| 14 | Operations on the musculoskeletal system |
| 15 | Operations on the integumentary system |
| 16 | Miscellaneous diagnostic and therapeutic procedures |
Source: FSO – Schweizerische Operationsklassifikation (CHOP)
© FSO 2023
Regression results IT4
| Dependent variable: FATALITY | |||||||||
|---|---|---|---|---|---|---|---|---|---|
| (1) | (2) | (3) | (4) | (5) | (6) | (7) | (8) | (9) | |
| OBESITY | 0.780*** | 0.071** | 0.646*** | 2.368* | 2.209* | 1.272 | 0.838** | 0.906 | 0.826** |
| (0.067) | (0.074) | (0.047) | (1.116) | (1.033) | (0.540) | (0.071) | (0.061) | (0.067) | |
| AGE | 1.058*** | 1.089*** | 1.034*** | 1.134*** | 1.128*** | 1.064*** | 1.059*** | 1.059*** | 1.059*** |
| (0.003) | (0.006) | (0.002) | (0.007) | (0.007) | (0.007) | (0.002) | (0.002) | (0.002) | |
| GENDER | 0.741*** | 0.803*** | 0.788*** | 0.463*** | 0.465*** | 0.535*** | 0.767*** | 0.718*** | 0.731*** |
| (0.013) | (0.039) | (0.015) | (0.059) | (0.059) | (0.088) | (0.012) | (0.015) | (0.012) | |
| Constant | 0.001*** | 0.000*** | 0.002*** | 0.000*** | 0.000*** | 0.001*** | 0.005*** | 0.003*** | 0.006*** |
| (0.000) | (0.000) | (0.000) | (0.000) | (0.000) | (0.001) | (0.001) | (0.000) | (0.001) | |
| Observations | 953 127 | 492 645 | 392 392 | 76 392 | 65 861 | 8 913 | 953 800 | 891 513 | 933 983 |
| Pseudo (R2) | 0.251 | 0.302 | 0.181 | 0.217 | 0.207 | 0.098 | 0.256 | 0.266 | 0.261 |
| Fixed Effect | A and B | B | B | B | B | B | A and B | A and B | A and B |
Odd-ratios reported. *** 0.01, ** 0.05, * 0.10. In parenthesis clustered standard errors (hospitals).
Fixed Effect: A- Diagnoses category; B- Hospitals. Reference year 2022, otherwise specified when this is not the case.
Column (1) full sample 2022. Columns (2) and (3) restricted to cases with < 5 and ≥ 5 diagnoses.
Columns (4) to (6) cases with main diagnosis “Diseases of the musculoskeletal system and connective tissue”: without restrictions, restricted to cases with ≥ 2 and ≥ 10 diagnoses, respectively.
Columns (7) to (9) full sample 2019, 2020 and 2021 respectively.
Source: FSO – Medical Statistics of Hospitals
© FSO 2023
Regression results IIaT5
| Dependent variable: DURATION | |||||||||||
|---|---|---|---|---|---|---|---|---|---|---|---|
| (0) | (1) | (2) | (3) | (4) | (5) | (6) | (7) | (8) | (9) | (10) | |
| OBESITY | 0.785*** | 0.682*** | 0.825*** | 0.827 | 1.129*** | 0.743*** | 0.770*** | 0.881 | 0.824* | 0.803*** | 0.692*** |
| (0.027) | (0.043) | (0.038) | (0.100) | (0.046) | (0.034) | (0.057) | (0.110) | (0.082) | (0.065) | (0.030) | |
| AGE | 0.986*** | 0.985*** | 0.990*** | 0.994*** | 0.990*** | 0.996*** | 0.991*** | 0.999 | 0.991*** | 0.990*** | 0.985*** |
| (0.001) | (0.001) | (0.001) | (0.001) | (0.001) | (0.001) | (0.002) | (0.001) | (0.001) | (0.002) | (0.001) | |
| GENDER | 0.980*** | 1.103*** | 1.077*** | 0.984 | 1.284*** | 0.912*** | 1.027 | 0.954* | 0.948*** | 0.967*** | 1.012 |
| (0.006) | (0.013) | (0.012) | (0.038) | (0.028) | (0.017) | (0.021) | (0.024) | (0.019) | (0.009) | (0.010) | |
| Constant | 0.257*** | 0.330*** | 0.227*** | 0.462*** | 0.116*** | 0.165*** | 0.195*** | 0.125*** | 0.301*** | 0.235*** | 0.416*** |
| (0.018) | (0.015) | (0.019) | (0.049) | (0.011) | (0.011) | (0.021) | (0.007) | (0.023) | (0.034) | (0.025) | |
| Observations | 1 426 422 | 37 796 | 125 429 | 5 784 | 23 356 | 109 780 | 37 058 | 10 749 | 7 192 | 151 716 | 98 884 |
*** 0.01, ** 0.05, * 0.10. Hazard ratios reported. In parenthesis clustered standard errors (hospitals).
Reference year 2022. Columns refer to the diagnosis categories as per T2.
Column 0 refers to the full sample estimation. Depending on the case diagnoses categories and hospital fixed effects are used as additional controls.
Source: FSO – Medical Statistics of Hospitals
© FSO 2023
Regression results IIbT6
| Dependent variable: DURATION | |||||||||||
|---|---|---|---|---|---|---|---|---|---|---|---|
| (11) | (12) | (13) | (14) | (15) | (16) | (17) | (18) | (19) | (21) | (22) | |
| OBESITY | 0.789*** | 0.656*** | 0.772*** | 0.783*** | 0.841*** | 1 | 1.087 | 0.660*** | 0.638*** | 1.616 | 0.788 |
| (0.036) | (0.035) | (0.022) | (0.040) | (0.025) | (.) | (0.117) | (0.044) | (0.029) | (0.472) | (0.158) | |
| AGE | 0.986*** | 0.982*** | 0.984*** | 0.987*** | 0.995*** | 0.962 | 1.001 | 0.983*** | 0.982*** | 0.992 | 0.987*** |
| (0.000) | (0.001) | (0.001) | (0.001) | (0.001) | (0.028) | (0.002) | (0.001) | (0.001) | (0.007) | (0.004) | |
| GENDER | 0.913*** | 0.943*** | 0.952*** | 0.976 | 1 | 1.003 | 0.943 | 0.959*** | 1.007 | 1.040* | 1.033 |
| (0.010) | (0.020) | (0.006) | (0.020) | (.) | (0.021) | (0.038) | (0.010) | (0.010) | (0.022) | (0.122) | |
| Constant | 0.368*** | 0.372*** | 0.391*** | 0.314*** | 1.165*** | 0.239*** | 0.074*** | 0.533*** | 0.416*** | 0.677 | 0.334*** |
| –0.016 | (0.027) | (0.020) | (0.027) | (0.019) | (0.007) | (0.008) | (0.050) | (0.026) | (0.302) | (0.103) | |
| Observations | 116 632 | 14 218 | 179 013 | 80 829 | 93 583 | 29 741 | 9 088 | 53 558 | 180 698 | 61 107 | 211 |
*** 0.01, ** 0.05, * 0.10. Hazard ratios reported. In parenthesis clustered standard errors (hospitals).
Reference year 2022. Columns refer to the diagnosis categories as per T2.
Dropped categories for insufficient number of observations. Hospital fixed effects are used as additional controls.
Source: FSO – Medical Statistics of Hospitals
© FSO 2023
References
[1] Association between class III obesity (BMI of 40–59 kg/m2) and mortality: a pooled analysis of 20 prospective studies
Kitahara C.M., Flint A.J., Berrington de Gonzalez A., Bernstein L., Brotzman M., MacInnis R.J., Moore S.C., Robien K., Rosenberg P.S., Singh P.N., Weiderpass E., Adami H.O., Anton-Culver H., Ballard-Barbash R., Buring J.E., Freedman D.M., Fraser G.E., Beane Freeman L.E., Gapstur S.M., Gaziano J.M., Giles G.G., Håkansson N., Hoppin J.A., Hu F.B., Koenig K., Linet M.S., Park Y., Patel A.V., Purdue M.P., Schairer C., Sesso H.D., Visvanathan K., White E., Wolk A., Zeleniuch-Jacquotte A., Hartge P.
PLoS ONE, 8; 11(7): e1001673
July 2014
[2] CIM-10-GM 2022 Index systématique – Version française
OFS, Numéro OFS: 1188-2212.
Year 2021
[3] The Importance of Sweet Beverage Definitions When Targeting Health Policies — The Case of Switzerland
Angelica Sousa, Janice Sych, Sabine Rohrmann and David Faeh
Nutrients, 12(7): 1976,
July 2020
[4] Overweight and obesity in 5- to 6-year-old schoolchildren in Switzerland from 2003 to 2018
Narvaez Luisa F., Mahler Per, Thadikkaran-Salomon Lynne, Jeannot Emiliena
Swiss Medical Weekly, Vol. 150 No. 3132
August 2020
[5] National Health and Nutrition Examination Survey 2017–March 2020 Prepandemic Data Files—Development of Files and Prevalence Estimates for Selected Health Outcomes
Bryan Stierman, M.D., M.P.H.; Joseph Afful, M.S.; Margaret D. Carroll, M.S.P.H.; Te-Ching Chen, Ph.D.; Orlando Davy, M.P.H.; Steven Fink, M.A.; Cheryl D. Fryar, M.S.P.H.; Qiuping Gu, Ph.D.; Craig M. Hales, M.D., M.P.H.; Jeffery P. Hughes, M.P.H.; Yechiam Ostchega, Ph.D., R.N.; Renee J. Storandt, M.T. (A.S.C.P.), M.S.P.H.; and Lara J. Akinbami, M.D.
National Health Statistics Reports, No. 158
June 2021
[6] Enquête suisse sur la santé 2022
Marco Storni, Renaud Lieberherr, Martine Kaeser,
Actualité OFS, Numéro OFS: 213-1702
October 2023
[7] https://www.ruralhealthinfo.org/topics/obesity-and-weight-control
[8] Obesity and Mortality, Length of Stay and Hospital Cost among Patients with Sepsis: A Nationwide Inpatient Retrospective Cohort Study
Anh Tuan Nguyen, Chu-lin Tsai, Lu-yu Hwang, Dejian Lai, Christine Markham, Bela Patel,
PLoS ONE, 11(4): e0154599
April 2016
[9] Influence of Overweight and Obesity on Morbidity and Mortality among hospitalised Patients in Sri Lanka: A Single-Center Analysis
Dilrukshi M.D.S.A., Thotamuna V., Senarath Yapa D.J., De Silva L., Ranasinghe P., Katulanda P.,
Journal of Obesity, 18; 2022: 9172365
August 2022
[10] Impact of obesity on hospital complications and mortality in hospitalised patients with hyperglycaemia and diabetes
Anastasia-Stefania Alexopoulos and Maya Fayfman and Liping Zhao and Jeff Weaver and Lauren Buehler and Dawn Smiley and Francisco J. Pasquel and Priyathama Vellanki and J. Sonya Haw and Guillermo E. Umpierrez
BMJ Open Diabetes Research and Care, Volume 4, number 1
July 2016
[11] Length of Hospital Stays among Obese Individuals
Claire Zizza, Amy H. Herring, June Stevens, Barry M. Popkin,
American Journal of Public Health, No. 94. Pages 1587-91
September 2004
[12] Obesity and hospitalisation over the Adult Life Course: Does Duration of Exposure Increase Use?
Markus H. Schafer and Kenneth F. Ferraro,
Journal Health of Social Behaviour, No. 48(4). Pages 434-449
December 2007