Air passengers: scheduled and charter traffic
Passengers
T5.1
| 1990 | 2000 | 2010 | |
|---|---|---|---|
| Total airports | 19 944 463 | 34 426 801 | 39 009 046 |
| Zurich | 12 278 088 | 22 450 494 | 22 854 358 |
| Geneva | 5 488 703 | 7 677 763 | 11 748 972 |
| Basel-Mulhouse 2 | 1 776 784 | 3 699 194 | 4 087 931 |
| Bern-Belp | 88 584 | 205 314 | 85 981 |
| Lugano-Agno | 310 240 | 286 507 | 159 497 |
| Sion | 2 064 | 8 760 | 3 912 |
| St.Gallen-Altenrhein | 0 | 98 769 | 68 395 |
| 2019 | 2021 | 2022 | |
| Total airports | 58 561 919 | 19 667 667 | 43 570 768 |
| Zurich | 31 478 748 | 10 189 371 | 22 512 400 |
| Geneva | 17 826 513 | 5 830 770 | 13 958 454 |
| Basel-Mulhouse 2 | 9 068 206 | 3 610 270 | 7 034 591 |
| Bern-Belp | 22 233 | 11 236 | 35 230 |
| Lugano-Agno | 56 201 | 647 | 588 |
| Sion | 2 381 | 903 | 4 180 |
| St.Gallen-Altenrhein | 107 637 | 24 470 | 25 325 |
1 local and transfer passengers
2 Swiss and French traffic
Source: FSO, FOCA – Aviation, scheduled and charter traffic (AVIA_LC)
© FSO 2023


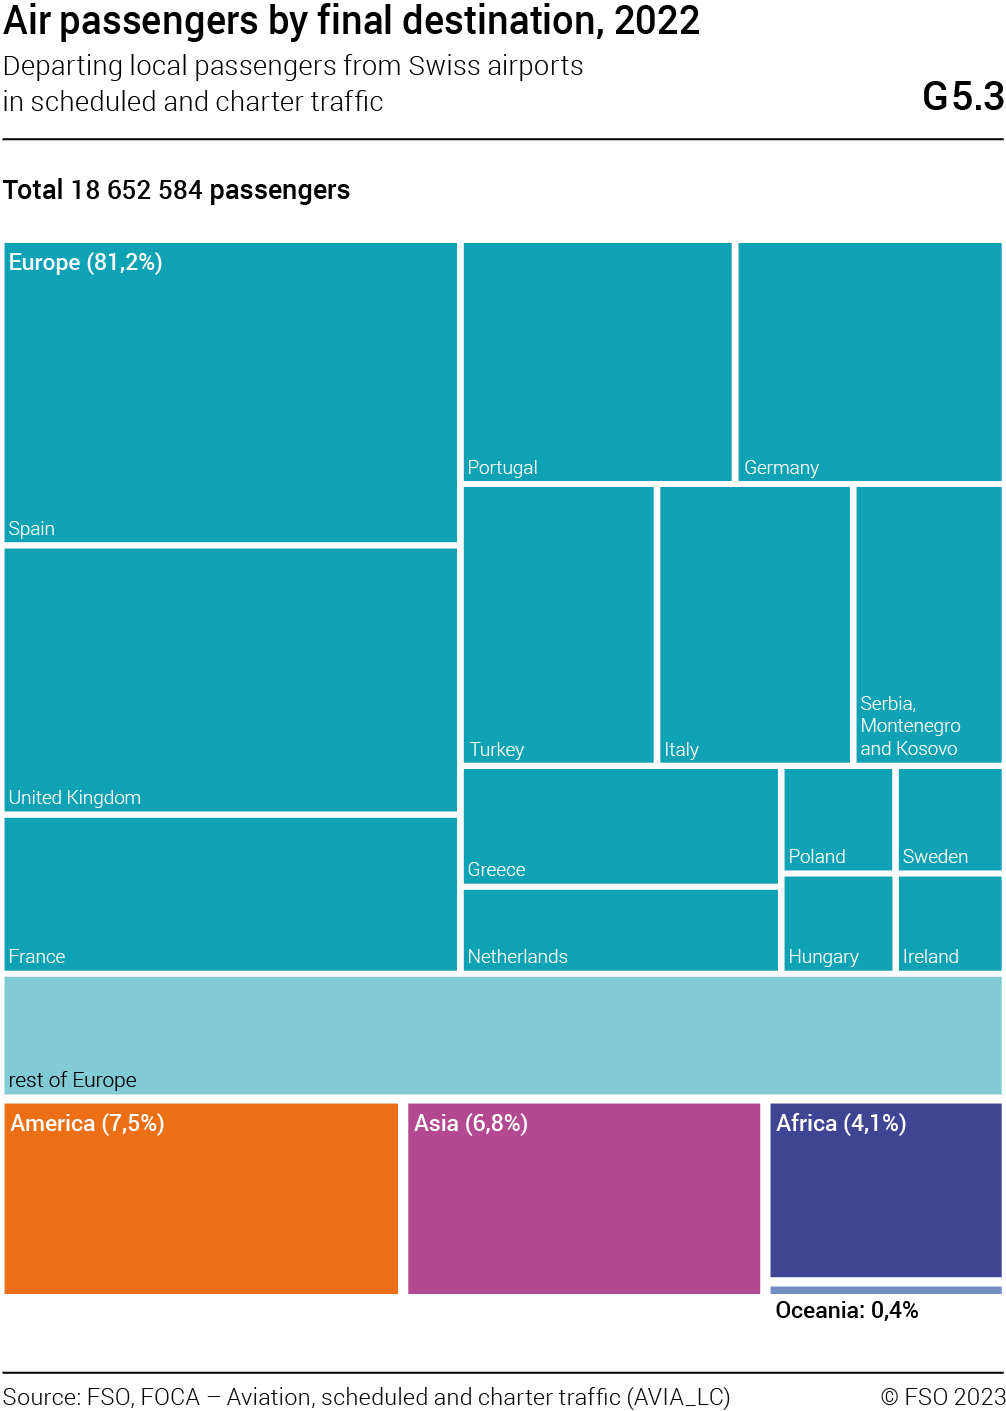
Air passengers by continent of final destination, 2022
Departing local passengers in scheduled and charter traffic
T5.2
| Europe | Africa | Asia | Oceania | |
|---|---|---|---|---|
| Total airports | 15 142 432 | 770 832 | 1 262 433 | 70 207 |
| Zurich | 5 968 614 | 309 540 | 834 462 | 61 014 |
| Geneva | 5 738 890 | 364 897 | 407 463 | 9 193 |
| Basel-Mulhouse 1 | 3 401 950 | 96 388 | 20 508 | 0 |
| Bern-Belp | 17 744 | 0 | 0 | 0 |
| Lugano-Agno | 298 | 0 | 0 | 0 |
| Sion | 2 107 | 0 | 0 | 0 |
| St.Gallen-Altenrhein | 12 829 | 7 | 0 | 0 |
| North America | Central America | South America | Total all continents | |
| Total airports | 1 055 701 | 137 892 | 213 087 | 18 652 584 |
| Zurich | 749 249 | 106 278 | 158 690 | 8 187 847 |
| Geneva | 302 972 | 31 614 | 54 397 | 6 909 426 |
| Basel-Mulhouse 1 | 3 480 | 0 | 0 | 3 522 326 |
| Bern-Belp | 0 | 0 | 0 | 17 744 |
| Lugano-Agno | 0 | 0 | 0 | 298 |
| Sion | 0 | 0 | 0 | 2 107 |
| St.Gallen-Altenrhein | 0 | 0 | 0 | 12 836 |
1 Swiss and French traffic
Source: FSO, FOCA – Aviation, scheduled and charter traffic (AVIA_LC)
© FSO 2023
Transport performance by airport
Incoming and outgoing scheduled and charter traffic
T5.3
| Scheduled traffic: Passenger-km performed, in millions |
Charter traffic: Passenger-km performed, in millions |
|||||
|---|---|---|---|---|---|---|
| 2019 | 2021 | 2022 | 2019 | 2021 | 2022 | |
| Total | 111 475 | 32 311 | 78 980 | 940 | 437 | 722 |
| Zurich | 79 743 | 20 970 | 53 476 | 379 | 127 | 237 |
| Geneva | 22 316 | 7 259 | 17 778 | 125 | 7 | 41 |
| Basel-Mulhouse 1 | 9 335 | 4 059 | 7 668 | 420 | 292 | 433 |
| Bern-Belp | 7 | 4 | 44 | 15 | 10 | 8 |
| Lugano-Agno | 5 | 0 | 0 | 0 | 0 | 0 |
| Sion | 1 | 0 | 0 | 1 | 0 | 3 |
| St.Gallen-Altenrhein | 68 | 19 | 13 | 0 | 0 | 0 |
1 Swiss and French traffic
Source: FSO, FOCA – Civil aviation statistics (AVIA_ZL)
© FSO 2023
Transport performance and seat load factor
by continent
Incoming and outgoing scheduled and charter traffic
T5.4
| Passenger-km performed, in millions |
Seat load factor | |||||
|---|---|---|---|---|---|---|
| 2019 | 2021 | 2022 | 2019 | 2021 | 2022 | |
| Total | 112 415 | 32 748 | 79 701 | 81% | 59% | 78% |
| Europe | 45 231 | 18 772 | 36 852 | 81% | 69% | 79% |
| Africa | 6 185 | 2 054 | 4 877 | 77% | 58% | 77% |
| Asia | 32 648 | 4 653 | 16 876 | 78% | 37% | 75% |
| Oceania 1 | 0 | 0 | 0 | * | * | * |
| North America | 23 215 | 5 123 | 17 428 | 83% | 55% | 78% |
| Central America | 1 877 | 788 | 1 400 | 89% | 73% | 86% |
| South America | 3 259 | 1 358 | 2 267 | 89% | 63% | 95% |
1 In 2019, 2021 and in 2022 no direct flights from/to Switzerland
* not
indicated because data was not applicable
Source: FSO, FOCA – Civil aviation statistics (AVIA_ZL)
© FSO 2023