Comments on findings
Labour market indicators 2023
The publication “Labour market indicators” presents the main highlights among the vast range of employment data. The information is arranged to provide an overview of the Swiss labour market, along with the relevant statistics. Topics covered include employment, working hours, unemployment, job vacancies, dynamic aspects of the labour market, as well as salary structure and trends.
It consists of three sub-publications. This document comments on the results of the labour market indicators for the period 2017–2022 and the outlook for 2023. The additional document “Definitions” provides an overall view of the definitions used in the labour market statistics, while the “Statistical Sources” describes the methodological aspects of the various data sources.
Abbreviation in the graphs
EFTA European Free Tarde Association
ELS-ILO Unemployment Statistics (ILO-based)
ES Employment Statistics
ESS Swiss Earnings Structure Survey
EU European Union
EUROSTAT Statistical office of the European Union
GDP Gross domestic product
JOBSTAT Job Statistics
ILO International Labour Office
LMA Labour Market Accounts
SECO State Secretariat for Economic Affairs
SLFS Swiss Labour Force Survey
SWI Swiss Wage Index
WAS Wage agreements survey
WV Work Volume Statistics
2017–2022: Main labour market trends in Switzerland
Since the second half of 2021, the situation on the Swiss labour market improved. 2022 is part of this continuity. From the 4th quarter 2021 to the 4th quarter 2022, the number of unemployed persons based on the ILO definition (International Labour Office) and the number of people working short-time declined, while the number of job vacancies increased. In the five years from the 4th quarter 2017 to the 4th quarter 2022, the number of employed persons in Switzerland increased. Over the same period, the unemployment rate based on the ILO definition and the registered unemployment rate (persons registered at regional placement offices, RAV, as unemployed) fell, despite a stronger fluctuation during the crisis.
Return to economic growth
Prior to the COVID-19 pandemic, Swiss economic growth was relatively stable (+0.5% on average per quarter between the 4th quarter 2017 and the 4th quarter 2019). In 2020, the pandemic caused a slowdown, with GDP falling by 7.1% between the 1st and 2nd quarters before recovering in the following quarter (+7.3%). The trend then remained relatively stable until the 1st quarter of 2021 (+0.3% and –0.1%). The 2nd and 3rd quarters of 2021 saw an above-average increase in economic activity, with rises of 2.0% and 1.7% respectively compared with the previous quarter. GDP returned to its pre-crisis level in the 2nd quarter of 2021. In 2022, economic activity continued to grow, but at a slower pace (+0.8% annual growth).
Employment: recovery after the pandemic
According to the Employment Statistics (ES), which are based on a survey of economically active persons (Swiss Labour Force Survey, SLFS), the number of employed persons rose by 3.8% between the 4th quarter 2017 and the 4th quarter 2022, rising from 5.050 million to 5.242 million. At the same time, the Job Statistics (JOBSTAT), which are based on a survey of secondary and tertiary sector enterprises, also showed an increase in the number of jobs (+7.9%), rising from 5.0 million to 5.4. An initial period of growth was recorded between the 4th quarter of 2017 and the 4th quarter of 2019 in both the number of people in employment (+1.8%) and the number of jobs (+3.1%). In 2020, a year marked by the COVID-19 pandemic, the ES reported a 0.3% decrease, while the JOBSTAT remained unchanged. Both then returned to positive annual growth at the end of 2021 (+0.3% and +2.4%). Between the 4th quarter of 2021 and the 4th quarter of 2022, their numbers rose by 0.8% and 2.3% respectively.

Decline in unemployment
Over five years, the unemployment rate based on the ILO definition fell, decreasing from 4.5% to 4.1% in the 4th quarter of 2022, and the registered unemployment rate (in a regional placement office, RAV) saw a more marked delineate, decreasing from 3.2% to 2.1%. The relatively large difference between these two rates can be explained by the fact that the first rate also includes job seekers who are not registered at RAV.
At the end of 2017, some 1660 persons were working reduced hours, compared with 3160 in 2022. This figure however varied considerably between March 2020 and December 2022: after a peak of 1.4 million persons in April 2020, short-time working still affected 388 000 persons at the end of 2020 and 65 000 persons in December 2021.
Rise in the number of job vacancies
According to JOBSTAT, the number of vacancies available in the 4th quarter of 2022 was 96.1% higher than five years earlier. It had fallen in 2020 (–15 200 between the 4th quarter of 2019 and the 4th quarter of 2020), but then recovered strongly from the 1st quarter of 2021, reaching annual growth of 54.7%. Between the 4th quarter of 2021 and the 4th quarter of 2022, there was still a positive annual trend (+18 700, +18.1%).

40.7% of companies (weighted according to the number of jobs) indicated that they had difficulty recruiting qualified personnel in the 4th quarter 2022 (+4.7 percentage points compared with the 4th quarter 2021). However, this sharp rise needs to be put into context: the pandemic had a major impact on the Swiss labour market in 2020, with a decrease in labour demand. This trend has been reversed since the 1st quarter 2021. A comparison of the past five years also reveals that companies had never had such difficulty in finding suitable personnel as they did in the 4th quarter 2022 (+10.6 percentage points between the 4th quarter 2017 and the 4th quarter 2022).
Growth in nominal wages and decline in real wages
In 2022, nominal wages recorded an average increase of 0.9% compared with the previous year. In real terms, with exceptional inflation at 2.8% in 2022, the purchasing power of wages in the economy as a whole fell by 1.9%, following an increase of 1.5% in 2020 and a fall of 0.8% in 2021. The purchasing power of wages fell for the sixteenth time since the Swiss wage index was created in 1942. Over the last five years from 2018 to 2022, the average annual rate of increase in real wages for all employees was –0.2%. Over this period, men's wages fell by 0.3% while women's wages fell by 0.1%. This sustained growth in the wage index for women is in keeping a long-term trend. Women's wages have become more similar to men's (23.7% median wage gap in 1994 compared with 10.8% in 2020) but the gender wage gap persists.

2017–2022: The situation of men and women in the labour market
Between 2017 and 2022, the share of women participating in the labour market slightly increased. In 2022, women were still, however, considerably more likely than men to be working part-time (57.7% compared with 19.3%). Over a five-year period, the ILO unemployment rate fell for both men (–0.3 percentage points to 3.9%) and women (–0.5 percentage points to 4.4%). When comparing median wages in the whole economy in full-time equivalents, the gender wage gap was 10.8% in 2020, with only part of this difference explained by objective criteria.
Part-time work increasing among men
Part-time work is much more common among women than men. In the 4th quarter 2022, 57.7% of all employed women worked part time (in other words had a work-time percentage of less than 90%), i. e. 0.6 percentage points less than in the 4th quarter 2017. Among men, this rate has risen by 1.3 percentage points since the end of 2017 (to 19.3%). The unequal distribution of part-time work is also one of the reasons why women accounted for only 39.2% of the total actual hours worked in 2022. In the 4th quarter 2022, 491 000 men worked part-time compared with 1.3 million women.
Women more likely than men to be employed in the services sector
For both sexes, the number of people in work followed a comparable trend in the secondary and tertiary sectors between the 4th quarter of 2017 and the 4th quarter of 2022. The number of women and men employed in the secondary sector rose by 1.9% and 0.7% respectively. Growth in the tertiary sector was higher, at +5.5% and +5.4% respectively. Proportionally, women worked considerably more frequently in the services sector than men in the 4th quarter 2022 (88.0% of all employed women compared with 68.4% of all employed men). Only 10.3% of women are employed in industry and 1.7% in agriculture. The share of employed men working in industry is 28.6% and in agriculture 3.0%.

Share of women in economically active population rose slightly
The number of economically active persons (employed and ILO unemployed persons together, corresponding to the labour supply) rose between the 4th quarter 2017 and the 4th quarter 2022 by 0.8% among men (to 2.642 million) and by 2.5% among women (to 2.328 million). Over a five year period, the share of women in the economically active population thus rose slightly (+0.4% percentage points to 46.8%). Both the number of women and men in work rose (+4.3% and +3.4%).

Decline in the unemployment rate for both genders
Between the 4th quarter 2017 and the 4th quarter 2022, the unemployment rate based on the ILO definition fell both among women (from 4.9% to 4.4%) and among men (from 4.3% to 3.9%). While women were more affected by the COVID-19 pandemic (+1.2 percentage points between the 4th quarter of 2019 and the 4th quarter of 2020 reaching 5.4%, compared with +0.8 points at 4.5% for men), the gap disappeared in the 4th quarter of 2021 (–0.9 points for women compared with –0.1 points for men) at 4.5% and 4.4% respectively.

Wage inequality between women and men is gradually decreasing
In 2020, the monthly median wage of women in the overall economy was CHF 6211 and that of men CHF 6963. The wage gap has narrowed since 2014, decreasing from 12.5% to 12.0% in 2016, to 11.5% in 2018 and to 10.8% in 2020. In the private sector, women earned 13.8% less than men in 2020, and 10.5% less in the public sector.
According to an analysis commissioned by the Federal Statistical Office, 52.2% of the wage gap (arithmetic mean) in 2020 in the whole economy could be explained by objective factors such as place in the hierarchy, number of years' service or education. 47.8% of the pay gap remains unexplained.

2017–2022: Swiss and foreign labour force
Since 2001 Switzerland has experienced a high influx of foreign workers. Between 2017 and 2022, the number of foreigners in the labour force rose sharply, while that of Swiss nationals only increased slightly. Without naturalisations, the difference would have been markedly greater. Over the entire period under review, the unemployment rate based on ILO definition was two to three times higher among foreign nationals than among Swiss nationals. Swiss workers generally earn more than their foreign counterparts, except in jobs with a high level of responsibility.

Level of foreign labour immigration remains high
Between the 4th quarter of 2017 and the 4th quarter 2022, the number of economically active persons with foreign nationality (employed and ILO unemployed) grew much faster than that of economically active Swiss nationals (+9.7% to 1.8 million compared with +0.4% to 3.6 million). The strong rise in the number of foreign workers is the result of heavy immigration: during the period 2017 to 2021 (cumulation of 5 years), immigration of foreign workers exceeded the number of emigrations by 191 000 persons. In contrast, the migration of economically active Swiss nationals resulted in a negative balance of 19 000 persons. Naturalisations play a role in the structure of the economically active population: from 2017 to 2021, some 121 000 economically active foreigners obtained Swiss nationality. Were it not for these naturalisations, the number of foreign economically active persons would have increased by 17.0% between 2017 and 2022, whereas that of the Swiss economically active population would have fallen (–3.0%). In the 4th quarter 2022, the share of foreign nationals in the economically active population was 33.7% compared with 31.7% five years earlier.

Foreign nationals more often affected by unemployment
In the 4th quarter of 2022, 3.5 million Swiss nationals were employed in the labour market and 104 000 were unemployed based on the ILO definition. Thus, the unemployment rate stood at 2.9%, down on the 4th quarter of 2017 (3.5%). The unemployment rate based on the ILO definition was higher for the foreign population. 1.7 million foreign nationals were employed and 102 000 were unemployed in the 4th quarter of 2022. For foreign nationals, the unemployment rate based on the ILO definition was 7.3% and therefore slightly decreased in comparison with the 4th quarter 2017 (7.5%).
Less part-time work among foreign nationals
Between the 4th quarter 2017 and the 4th quarter 2022, the number of people working part-time rose among both Swiss and foreign workers (+0.8 percentage points to 40.9% and +0.8 percentage points to 27.3%). This type of work is common among women, albeit more common among Swiss women than foreign women: in the 4th quarter 2022, 61.0% of Swiss women worked part-time, compared with 47.7% of foreign women. Among men, the corresponding shares were 22.2% and 12.5% respectively.

More foreigners work in paid employment
Foreign workers are mainly salaried employees (94.2% compared with 89.5% of employed Swiss nationals). Only 5.8% are self-employed or work in a family-run enterprise, considerably less than Swiss workers (10.5%). This difference is attributable to several factors: in addition to the matter of integration comes the impossibility for the vast majority of first generation foreign nationals to take over a family-owned business. Moreover, the share of persons under age 40 is larger in the foreign population than in the Swiss population, whereas the 40 to 64-year-old age group has a much higher proportion of self-employed persons than among those aged under 40.
Increase in the share of foreign cross-border commuters
The structure of the employed foreign population by permit status has changed only slightly in the past five years. While the share of cross-border commuters with a G permit and the share of workers with a B permit (residence permit) increased (by 1.4 percentage points to 21.8% and 0.8 percentage points to 28.2% respectively), the share with a C permit (permanent residence permit) decreased (by 1.8 percentage points to 45.4%). The same is true of holders of short-term residence permits (L permits), down 0.9 percentage points to 2.2%.

Foreign employees: differences depending on residence status
In 2020, in the economy as a whole, the median monthly wages of Swiss employees were higher than those of foreign workers (CHF 6988 compared with 6029). This wage gap in favour of Swiss workers compared with foreign workers was observed across all categories of residence.
However, when looking at jobs with a high level of responsibility, foreign workers had higher wages than their Swiss counterparts. Among senior managers, cross-border commuters earned CHF 10 692, those with resident permits CHF 12 268 and Swiss employees CHF 10 346.
The opposite held true for jobs without managerial responsibility. At CHF 6345, the wages of Swiss workers were higher than those of foreign workers: CHF 5773 for cross-border commuters and CHF 5287 for residence permit holders.
2017–2022: Working conditions in Switzerland
Working conditions in Switzerland changed between 2017 and 2022: there was a drop in the actual hours worked. The same period saw an increase in flexible working hours, the number of fixed-term contracts and working from home.
Actual annual hours worked decrease
Between 2017 and 2022, the actual annual hours worked per job continued to fall, settling at 1432 hours, i. e. a decline of 1.9% over five years. After a more marked decline between 2019 and 2020 due to the COVID-19 pandemic (–3.0%), the number of actual hours worked per job remained stable between 2021 and 2022 (–0.1%).
Over five years, the actual annual hours worked fell more sharply among men (–3.0%) while it remained unchanged among women. The decline was higher among self-employed persons (–11.2%) than among employees (–1.2%).
Taking into account only full-time employees, actual weekly hours worked fell between 2017 and 2022 (–72 minutes to 40.0 hours). The number of hours has increased since 2020: +3.1% between 2020 and 2021 and +1.5% between 2021 and 2022. This growth follows the decline recorded between 2019 and 2020 (–7.2%).

Flexible working hours on the rise
In 2022, 47.2% of employees had flexible working hours (compared with 44.0% in 2017). Men were more likely to have flexible working hours than women (51.8% compared with 42.2%). However, since 2017 the percentage of women with flexible working hours (+4.0 percentage points) has seen a greater increase than among men (+2.6 percentage points).
Young employed persons change jobs more often
Professional mobility rose slightly in Switzerland between 2017 and 2022. Overall, 12.8% of employed persons changed job in 2022 (compared with 12.1% in 2017); 3.9% of them within the same company and the remaining 8.9% to another company.
There was a slight difference in the percentage of women and men changing jobs (13.8% compared with 11.9%). With increasing age, however, professional mobility declines considerably: while approximately a fifth of 15 to 24 year-olds (21.4%) and 25 to 39 year-olds (19.5%) changed job in 2022, only 5.1% of 55 to 64 year-olds did so.

Young employees more often have a fixed-term contract
In the 4th quarter of 2022, 8.8% of employees worked on a fixed-term contract compared with 8.4% in 2017. The percentage of women (9.0%) was higher than that of men (8.6%). This type of contract was most common among employees aged 15 to 24 (25.1%, excluding apprentices). Conversely, people aged between 40 and 54 account for the lowest share (4.5%).

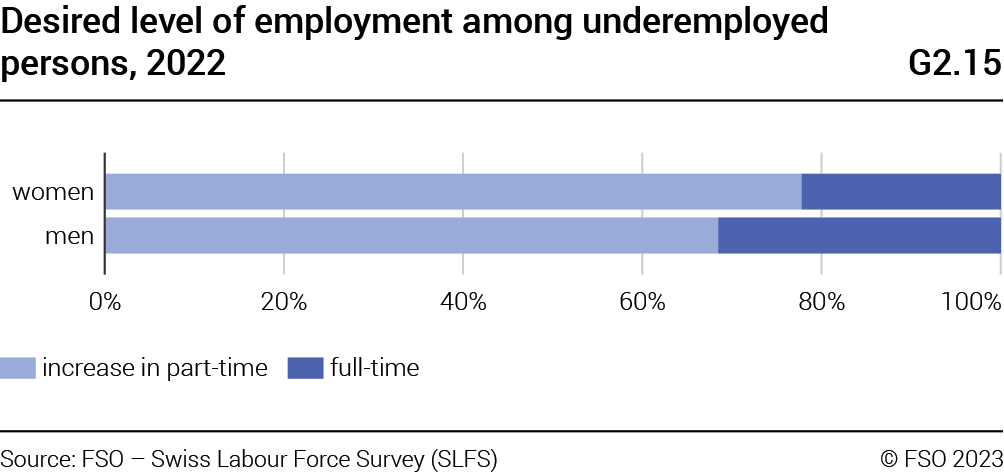
Women have a higher rate of underemployment
In the 4th quarter of 2022, around 228 000 people working part-time said they wanted to increase their rate of employment in the short term. This represented 4.6% of the economically active working population. Women are more often underemployed than men (6.8% compared with 2.6%). This is also the case for foreign workers (5.5% compared with 4.2% for the working population of Swiss nationality). Of those who are underemployed, 25.0% are looking for a full-time job, while the remaining 75.0% want to increase their part-time work.
On-call work more common among young employees and those over 65
In 2022, 16.7% of employed people regularly worked evenings, i. e. between 7pm and midnight, and 5.6% worked nights, i. e. between midnight and 6am. Evening work was more common among women (17.6%) than men (15.9%), while night work was more common among men (6.1%) than women (5.0%).
In 2022, 26.5% of employed people regularly worked on Saturdays. Women were more likely than men to work on Saturdays (29.5% compared with 23.9%). There are major differences according to age: employed people aged 15 to 24 and those aged 65 or over were the age groups most likely to work on Saturdays (32.7% and 32.6% respectively). In 2022, 15.8% of the working population worked on Sundays.
8.3% of employees (excluding apprentices) worked on-call in 2022. On-call work was more common among women (9.6%) than among men (7.0%). Looking at the different age groups, employees aged 65 and over are most often involved in this working pattern (27.7%); this is followed by the 15 to 24 age group (15.5%).

One in nine worked mainly from home in 2022
In 2022, 11.8% of people in employment worked mainly from home A distinction should be made between “working from home” and “teleworking from home”. The first term refers to any professional activity carried out at home, whereas the second is used specifically when the internet is used to exchange information with the employer or customers. In other words, “teleworking from home” is a form of “working from home”. . This form of work is carried out in similar proportions among women and men (12.1% and 11.5%).
Rise in the number of salaried employees subject to collective labour agreements (CLA) and standard employment contracts (STC)
On the 1st of March 2018, 581 CLAs covering just over 2.1 million salaried employees were listed. 566 CLAs were CLAs with normative provisions (covering 1.9 million persons) and 15 CLAs had no normative provisions (covering 200 000 persons).
As of 1 March 2018, 103 STCs issued by the Federal Council or the cantons were in force in Switzerland. This corresponds to 77 ordinary STCs and 26 STCs providing for mandatory minimum wages in an economic sector or occupation in which there is repeated and abusive wage dumping.
Within the framework of the main Collective Labour Agreements (CLAs), i. e. those covering at least 1500 persons, the social partners agreed on a nominal increase in real wages of 0.8% on average for 2022 (2021: 0.4%; 2020: 0.9%; 2019: 1.1%; 2018: 0.9). The CLAs ensure a wage increase that is often higher than that observed in the employed population as a whole.
For the year 2022, 9 cases of strike action were recorded, involving a total of 16 700 workers. This corresponded to 25 200 working days not worked.

Labour market in 1st quarter 2023 and short-term prospects
The number of employed persons increased in the 1st quarter 2023 compared with the same quarter of the previous year. The unemployment rate as defined by both the ILO and SECO fell. Employment forecasts were also optimistic at the end of the first quarter of 2023: the total economy offered 7000 more vacancies than in the first quarter of 2022 (+5.9%). The employment outlook indicator also points to an increase in employment in the short term, but slightly lower than in the first quarter of 2022 (–1.0%, from 1.08 to 1.07 A value above 1.00 indicates that a majority of companies plan to increase their headcount over the next three months, while a value below this threshold indicates the opposite. A value of 1.00 means that no change is expected. ), when the value was the highest since the indicator was introduced in 2004.
Rise in the number of employed persons and jobs
The number of employed persons rose by 108 000 or by 2.1% between the 1st quarters 2022 and 2023. This number increased both among men (+2.3% to 2.8 million) and women (+1.9% to 2.4 million). Furthermore, growth was weaker for employed Swiss nationals (+0.6% to 3.5 million) than for employed foreign nationals (+5.2% to 1.8 million). Among the latter, the number of employed persons grew mainly among short-term permit holders (L permit: +16.0% to 39 000 persons), among residence permit holders (C permit: +9.2% to 506 000 persons) and cross-border commuters (+6.2% to 384 000 persons).
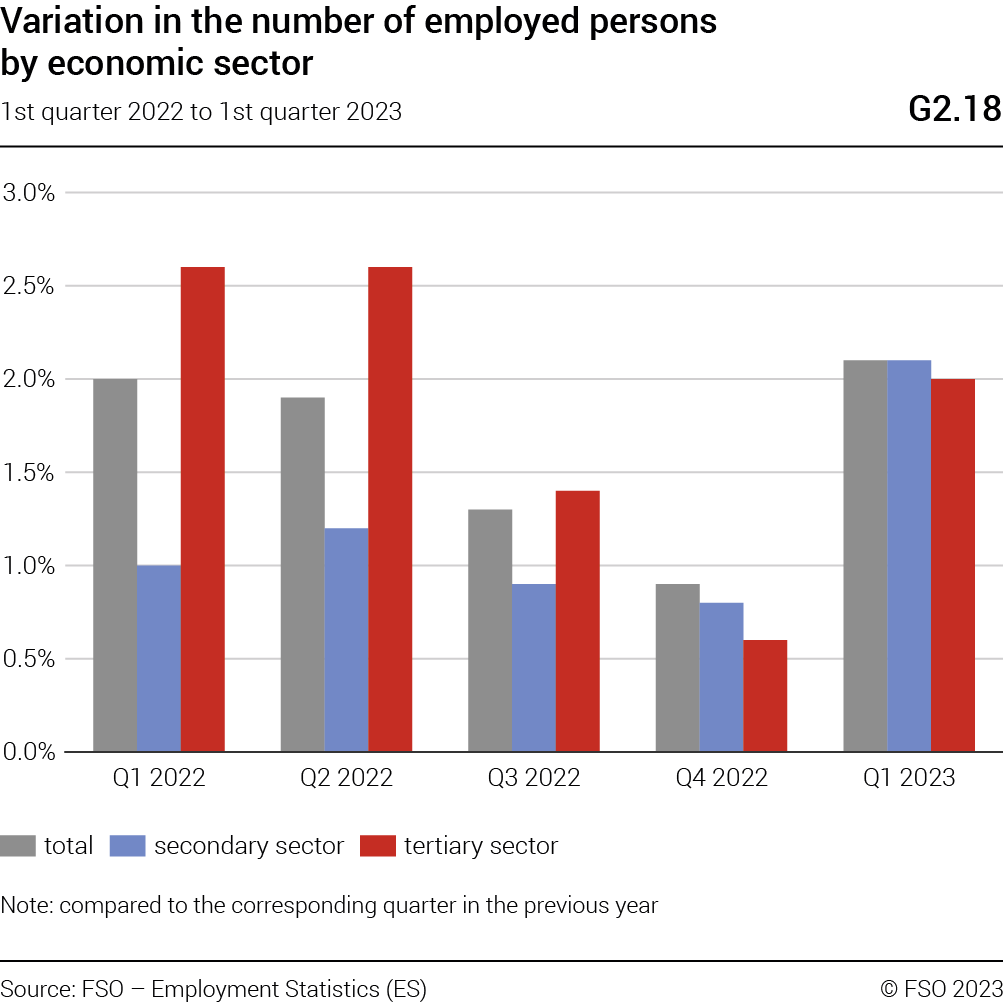
Between the 1st quarters 2022 and 2023, the number of jobs in the secondary and tertiary sectors also rose (+2.2%) The different trends in the number of employed persons (Employment Statistics (ES)) and in the number of jobs (Job Statistics (JOBSTAT)) may be due, amongst other things, to differences in the statistical universe (households for the former and companies for the latter), in the statistical unit (persons for the former and jobs for the latter) and in the reference period (quarterly average for the former and end of quarter for the latter). When the economic situation deteriorates, the ES tends to give a more positive picture than JOBSTAT, and a more negative one when the situation improves. . The number of jobs varied from one economic sector to another. The largest decreases were recorded in the manufacture of electrical equipment (–2.9%) and in postal and courier activities (–2.4%). In contrast, employment rose in water and air transport (+8.3%) and in the accommodation and food sector (+6.8%).
Decrease in the number of unemployed persons
In the 1st quarter 2023, 216 000 persons in Switzerland were unemployed as defined by the International Labour Office (ILO). These unemployed people represented 4.1% of the economically active population, compared with 4.4% in the 1st quarter of 2022. According to SECO, the unemployment rate was 2.0% at the end of March 2023, 0.4 percentage points lower than at the end of March 2022. In absolute terms, this represented some 93 000 people registered as unemployed in the 1st quarter of 2023 in a regional employment office and a decrease of almost 17 000 people compared with 12 months earlier.
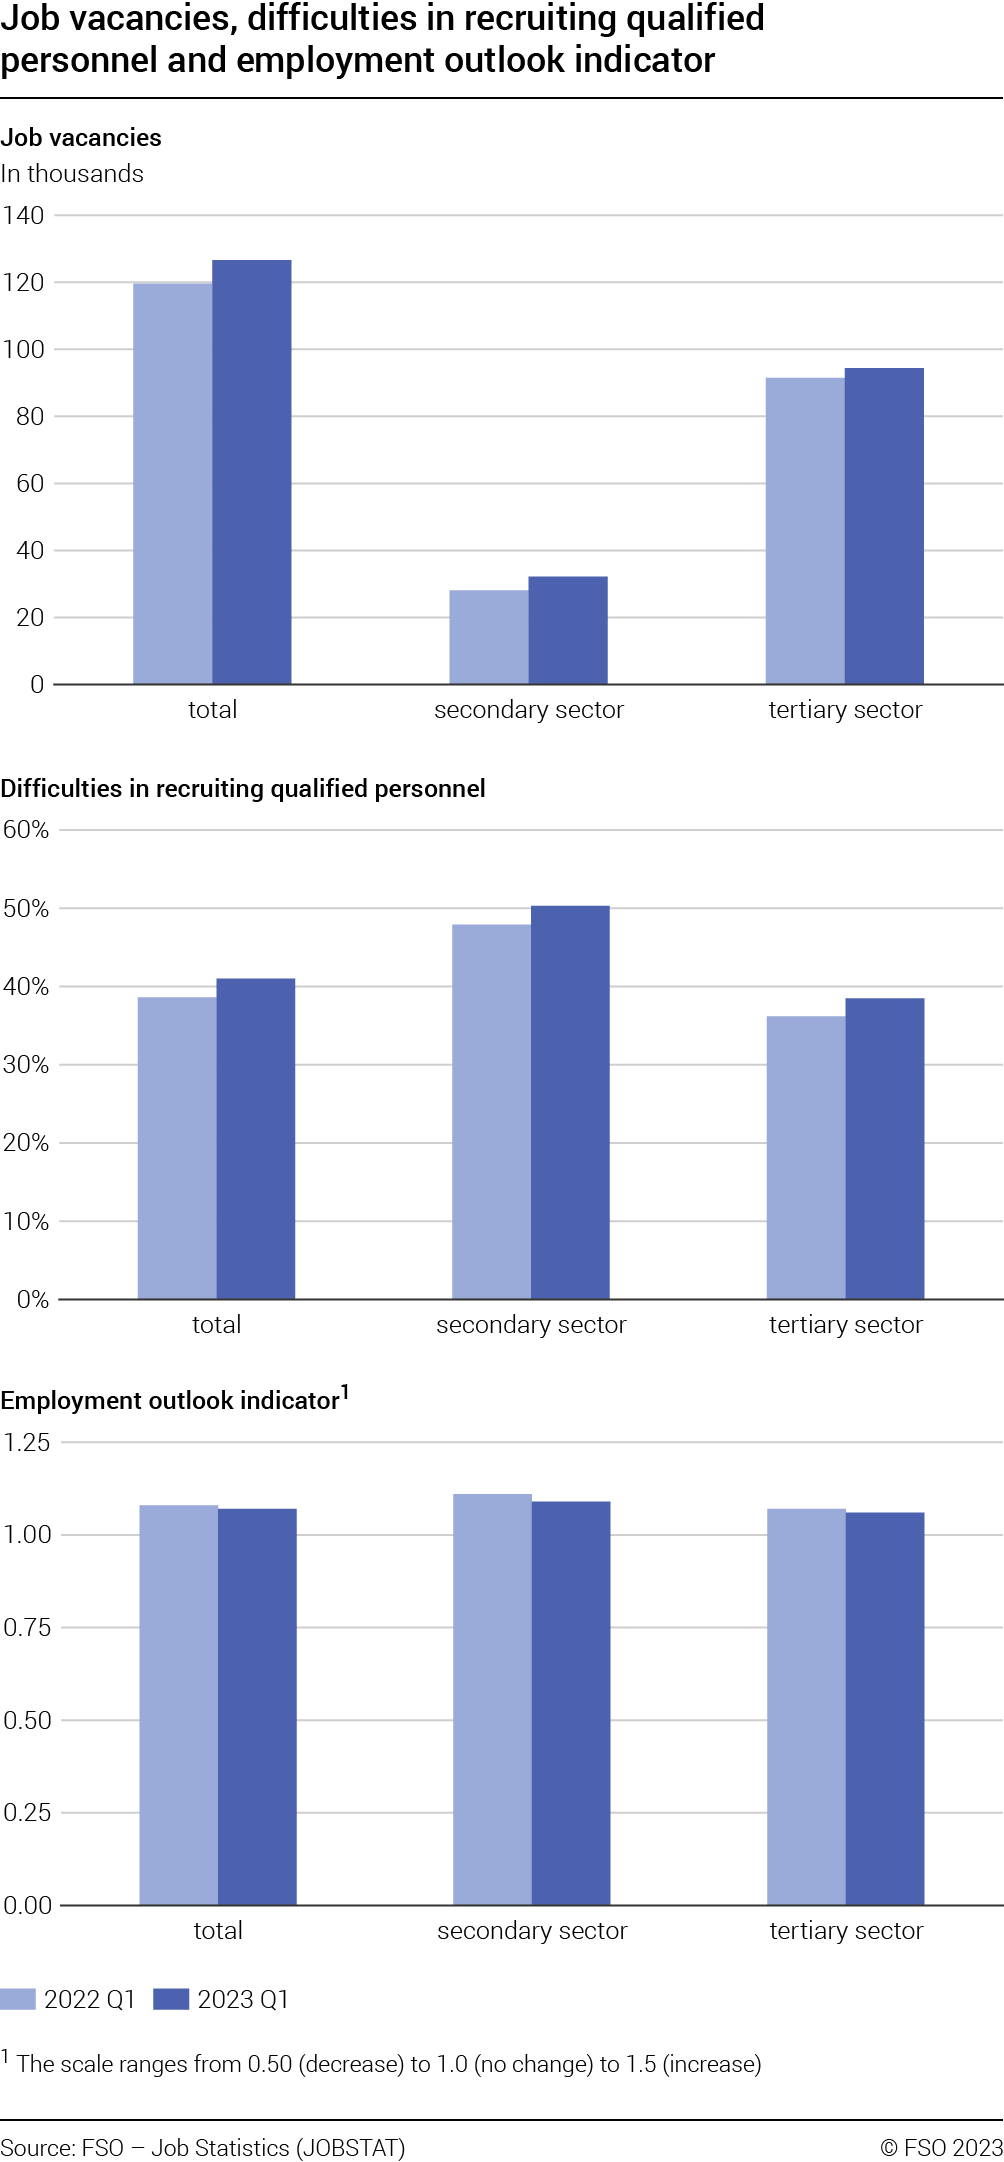
Increase in job vacancies
In the 1st quarter 2023, 127 000 job vacancies were counted in the secondary and tertiary sectors, i. e. 7000 more than in the same quarter of the previous year (+5.9%). The increase was significant in both the secondary sector (+14.8%) and the tertiary sector (+3.2%). The percentage of businesses experiencing difficulties in the recruitment of qualified personnel also grew considerably (+2.3 percentage points to 41.0%) compared with the 1st quarter 2022.
Jobs: optimistic outlook at the end of 1st quarter 2023
The employment outlook indicator, which represents the intention of secondary and tertiary sector businesses to hire new staff over the next three months, shows that the majority of companies wish to maintain or increase their headcount during the 2nd quarter of 2023. However, there has been a slight decline compared to the 1st quarter of 2022 (–1.0%). The decrease was observed in both the secondary (–1.4%) and tertiary sector (–0.8%). The sectors with the weakest outlooks are information technology and computer service activities (–6.2%), information and communication (–4.0%) and public administration (–3.4%). In contrast, the outlook indicator improved in administrative and support service activities (+1.1%), human health and social work activities and transportation and storage (both +0.9%). The indicator nonetheless remains above the threshold of 1 in all economic divisions, indicating that the majority of companies expect to maintain or increase their headcount.
The Swiss labour market in international comparison
The Swiss labour market stands up well in international comparison. Both the economic activity rate and women's participation in the labour market are among the highest in Europe. Women's relatively high labour market participation can be explained by widespread part-time employment: the proportion of employed persons working part-time is markedly higher in Switzerland than in most European countries. Wages in Switzerland converted into Euros are higher than in EU countries. If the wages are converted into purchasing power standards to take into consideration the different price levels, the differences are less substantial.
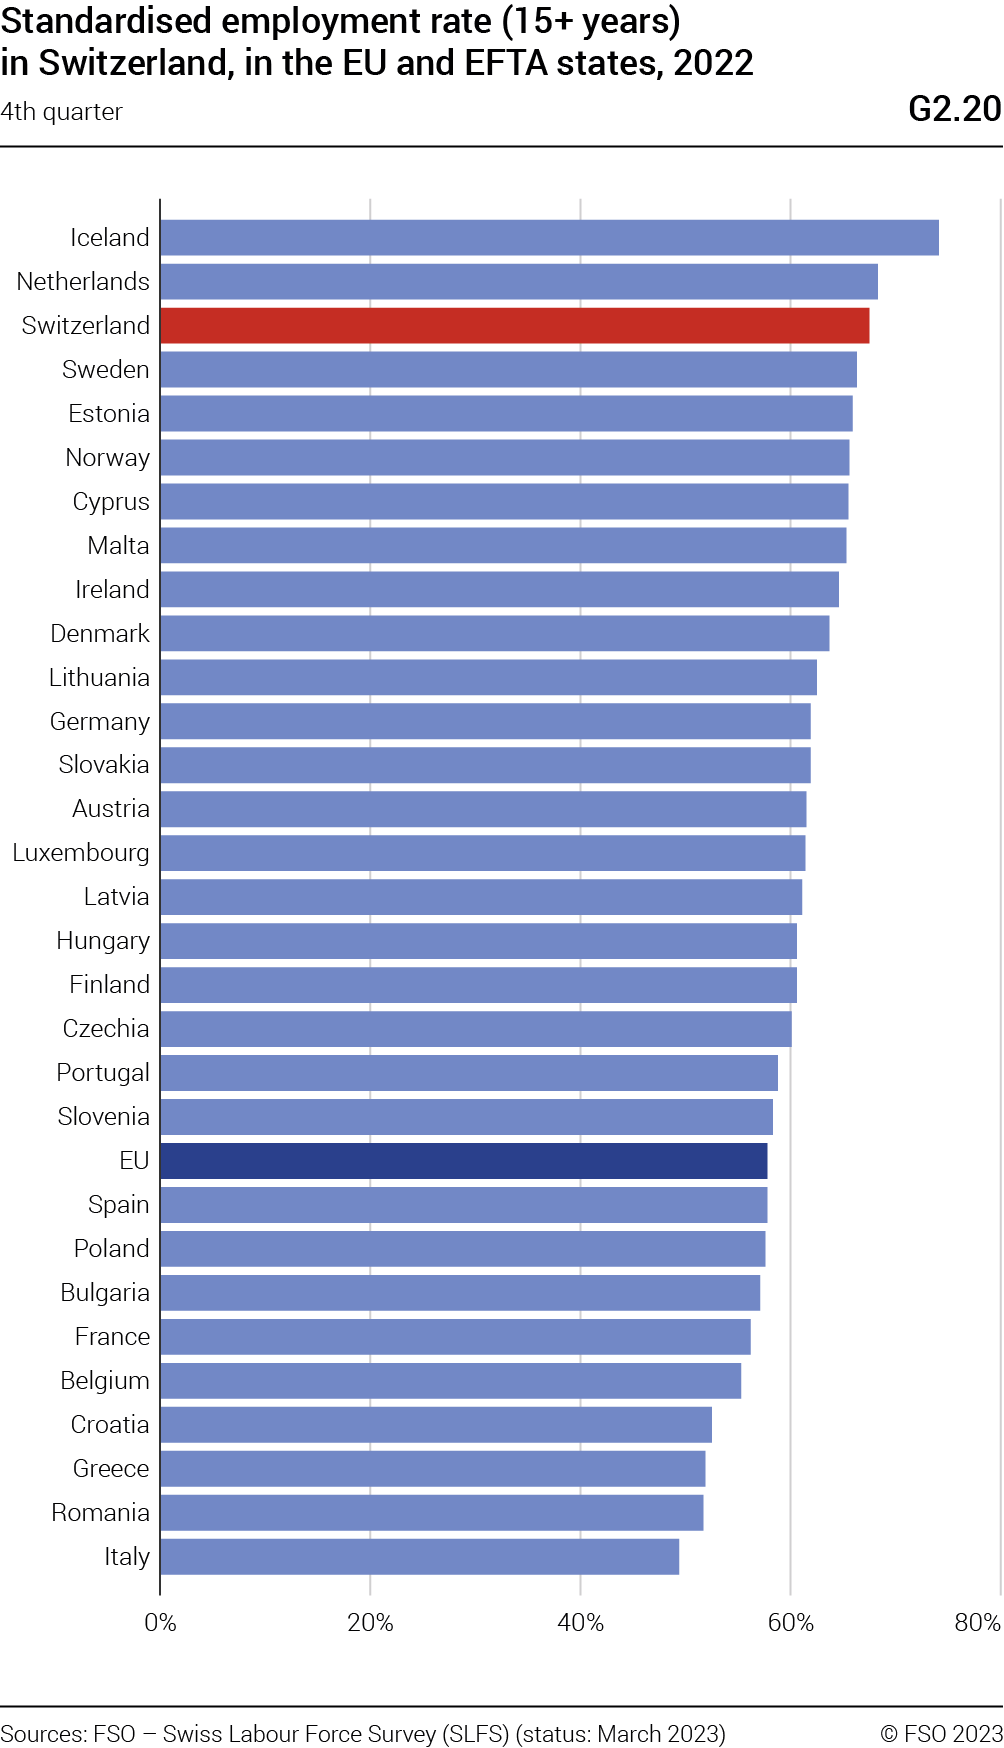
High economic activity rate in Switzerland
In the 4th quarter 2022, the activity rate of the population aged 15 and over reached 67.5% in Switzerland, one of highest rates in Europe. Only Iceland and the Netherlands had higher activity rates (74.1% and 68.3%), while Switzerland's neighbours had much lower rates (Germany: 61.9%; Austria: 61.5%; France: 56.2%, Italy: 49.4%). Italy recorded the lowest economic activity rate in Europe, just behind Romania (51.7%), Greece (51.9%) and Croatia (52.5%). The EU average was 57.8%.
Strong participation by women in the labour force in Switzerland and in North European countries
Women's labour force participation rates differ greatly from one country to another. In Italy, two-fifths of women aged 15 and over (41.2%) are in work, while the countries of Northern Europe have rates of over 60% (Iceland: 70.6%; the Netherlands: 64.0%; Sweden: 62.8%; Norway: 61.8%), along with Estonia (60.8%) and Cyprus (60.4%). In Europe as a whole, one in two women is economically active (52.2%). Compared with European countries, Switzerland ranks fourth with a rate of 62.3%; in the neighbouring countries, women's labour force participation is considerably lower (Germany: 56.8%, Austria: 56.4%; France: 52.5%). The employment of women in Switzerland is certainly facilitated by substantial availability of part-time jobs. In our country, 39.7% of employed persons work part-time (women: 60.8%). Only in the Netherlands was this percentage higher (43.7%; women: 63.9%). The proportion of part-time workers is particularly low in Bulgaria (1.9%; women: 2.2%), Slovakia (3.4%; women: 4.6%) and Romania (3.7%; women: 3.1%).
In all of the countries examined, the male labour force participation rate was higher than that of women. The highest male economic activity rate was found in Iceland (77.3%) which was followed by Switzerland (72.8%). It was considerably lower in Switzerland's neighbouring countries (Germany: 67.2%; Austria: 66.8%; France: 60.1%; Italy: 58.1%). The EU average stood at 63.8%.
Relatively low unemployment rate in Switzerland
In Switzerland, the unemployment rate based on the ILO definition fell by 0.3 points between the 4th quarter 2021 and the 4th quarter 2022 to 4.1%. The EU average also decreased by 0.3 points during the same period to 6.1%. Compared with the EU member states, Switzerland features among the countries with low unemployment rates. In Italy (7.9%), France (7.3%) and Austria (4.8%) the unemployment rate is considerably higher. In Germany, however, it is lower (3.0%). The lowest rates were recorded in the Czech Republic (2.2%), Malta and Poland (2.9%). In contrast, Greece and Spain are the European countries with the highest unemployment rate based on the ILO definition, with 11.9% and 12.9%.

Wages in international comparison
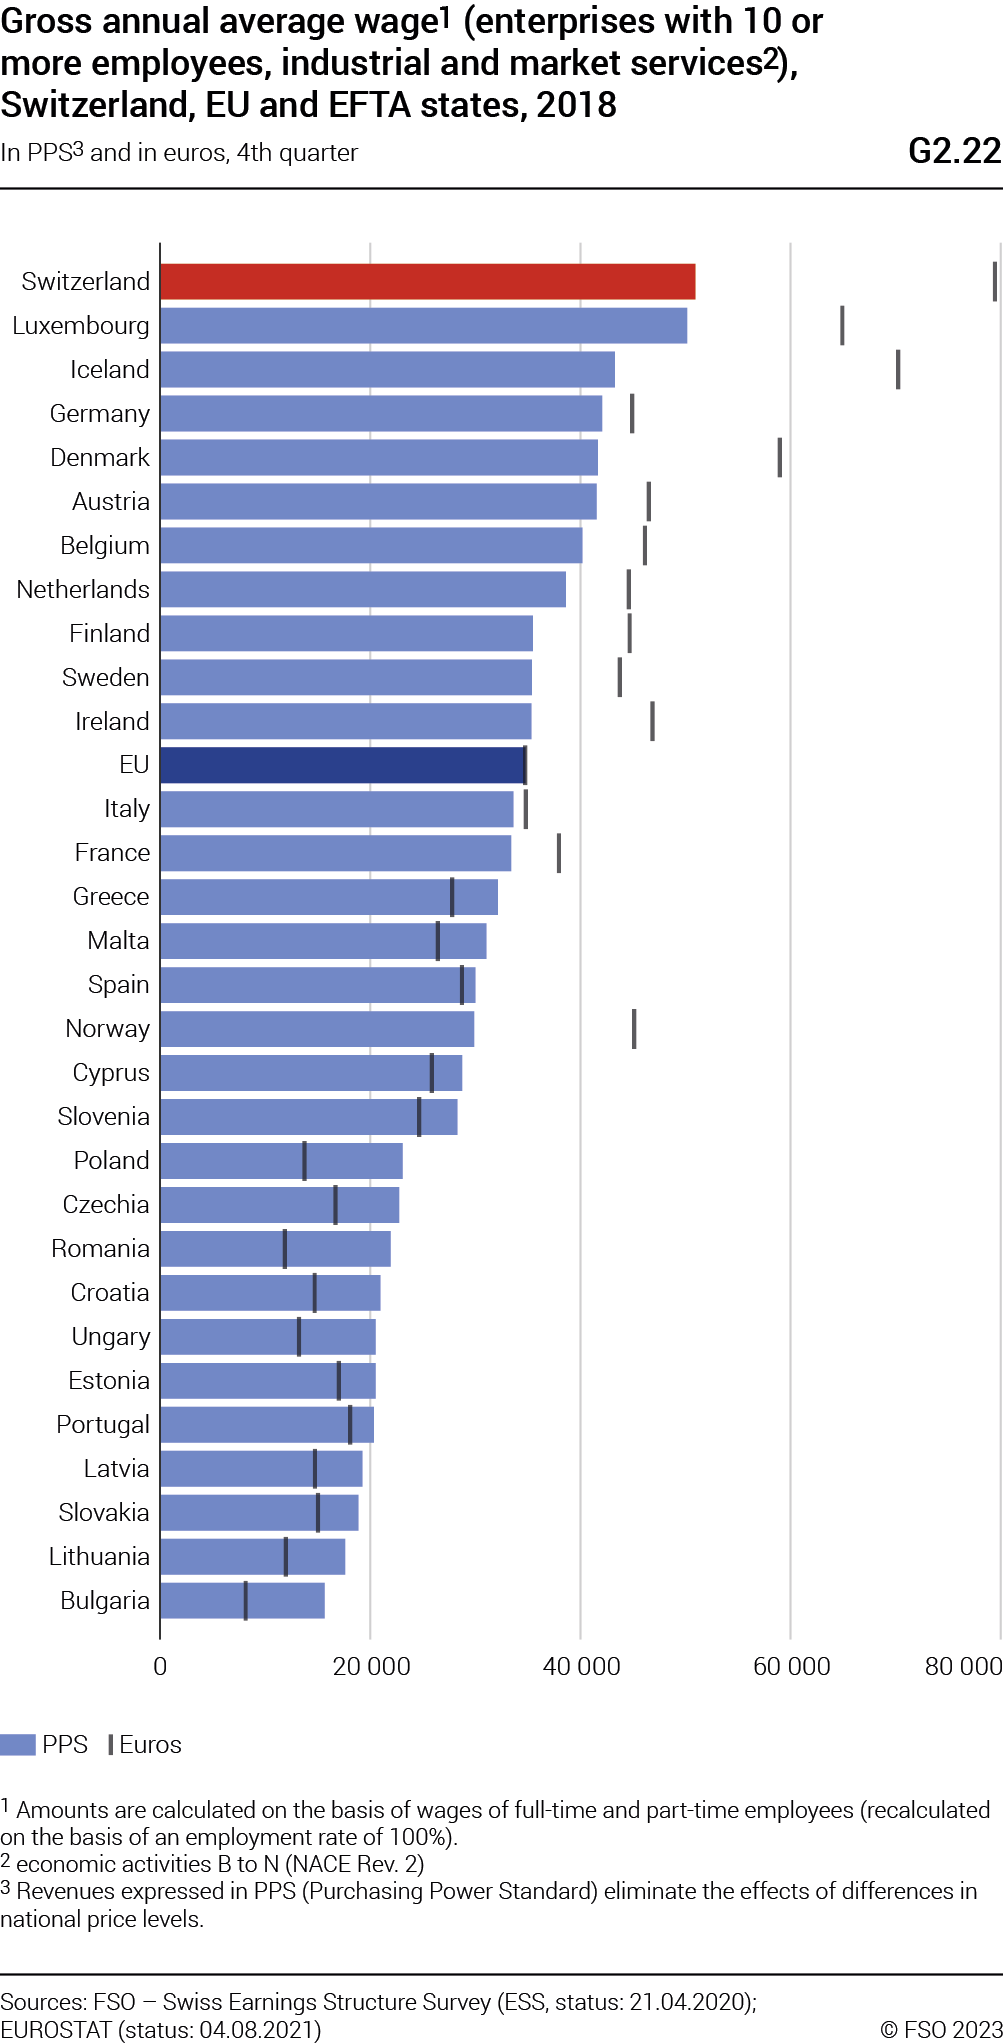
The comparison of average gross annual wages for employees working in industry and market services highlights the wage gap between the different EU countries. Distinct differences can be noted not only between the EU15 countries and member states that have joined the EU since 2004, but also within these two groups of countries.
In the EU15 states, a north south divide can still be observed: in 2018, the highest gross annual wages were recorded in Luxembourg (EUR 64 932), the lowest in Portugal (EUR 18 111). The wage gap is even greater when the new member states are also included: in 2018 Lithuania (EUR 11 959), Romania (EUR 11 874) and Bulgaria (EUR 8147) come last in terms of gross annual wages in euros. With a gross annual wage of EUR 79 442, partly influenced by the strong Swiss franc, Switzerland occupied first place in front of Luxembourg.
In order to depict the actual purchasing power of wages, they must be converted from their national currency to a collective, fictional currency, the purchasing power standard (PPS). If the different price levels of each country are taken into account, the extent of the wage divide between countries is altered. Expressed in euros, the wages paid in Switzerland are almost nine times higher than those paid in Bulgaria (+875%), whereas the difference is almost four times smaller (+225%) when converted into PPS. Looking at Switzerland's neighbouring countries, expressed in euros, the annual wages paid in Switzerland are 71% higher than those paid in Austria, 77% higher than in Germany, 109% higher than in France and 128% higher than in Italy. This difference is reduced when the comparison on average gross wages is made in PPS. The gaps are then only +23% compared with Austria, +21% compared with Germany, +52% compared with France and +51% compared with Italy.