2.1 Tourist accommodation in Switzerland
2020 was marked both nationally and internationally by the health and economic crisis linked to the COVID-19 pandemic. The various measures taken by Switzerland and foreign states have had a direct influence on the tourism sector as a whole and more particularly on the tourist accommodation sector. The statistical results for 2020 reflect the negative effects of this exceptional situation on this sector often with very "extreme" values that have never been seen in the past. While it is not possible to list measures taken at international level, a chronology of measures enacted in Switzerland provides a relevant context for the interpretation of the results.
Timeline (2020):
End of February: The Federal Council declares Switzerland as being in a "special situation". Events, conferences and seminars are cancelled for the first time.
March: The Federal Council declares an “extraordinary situation". The partial lockdown is introduced. Restaurants, shops, markets, leisure facilities and businesses where distance rules cannot be respected must close. However hotels remain open. Border checks are enforced with all neighbouring countries.
May: Easing of some health measures. Shops, compulsory schools, museums, libraries, restaurants and sports halls can gradually reopen but with strict health protection measures.
June: The Federal Council puts an end to the extraordinary situation. Leisure facilities and other tourist attractions can reopen. Spontaneous gatherings of up to 30 people are allowed again and demonstrations of up to 300 people can be organised. Restrictions on entry into Switzerland are lifted for all Schengen states.
October–November: start of the second wave of COVID-19. Progressive reintroduction of cantonal and federal health measures.
December: the pandemic situation deteriorates. The Federal Council reinforces health measures. "Non-essential" shops, restaurants, leisure and sports facilities and cultural centres are closed. The ski resorts remain open, however, as do hotels and their facilities (restaurants, gyms, spas, etc.) available to their guests.
2.1.1 Demand in tourist accommodation
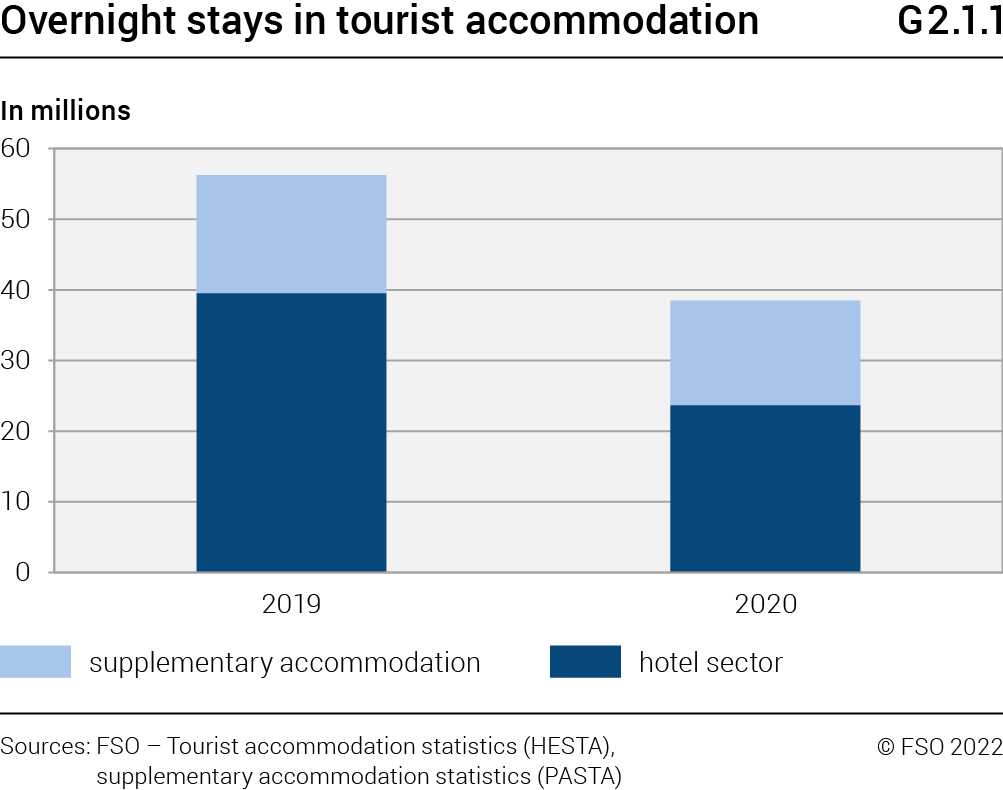
In 2020, tourist accommodation in Switzerland – that includes the hotel sector and supplementary accommodation – counted a total of 38.5 million overnight stays (G2.1.1). This corresponds to a decrease of 31.5% compared with the demand from 2019. The hotel sector represents the largest share of the demand with just over 60% of overnight stays recorded.
2.1.2 Swiss and foreign demand
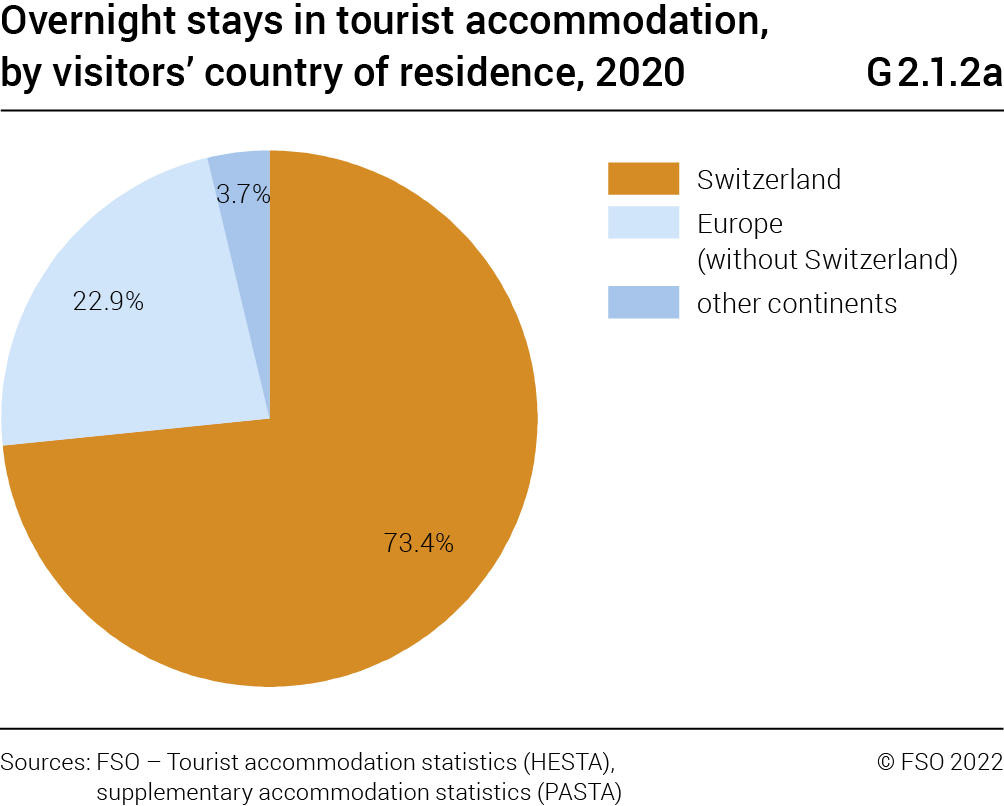
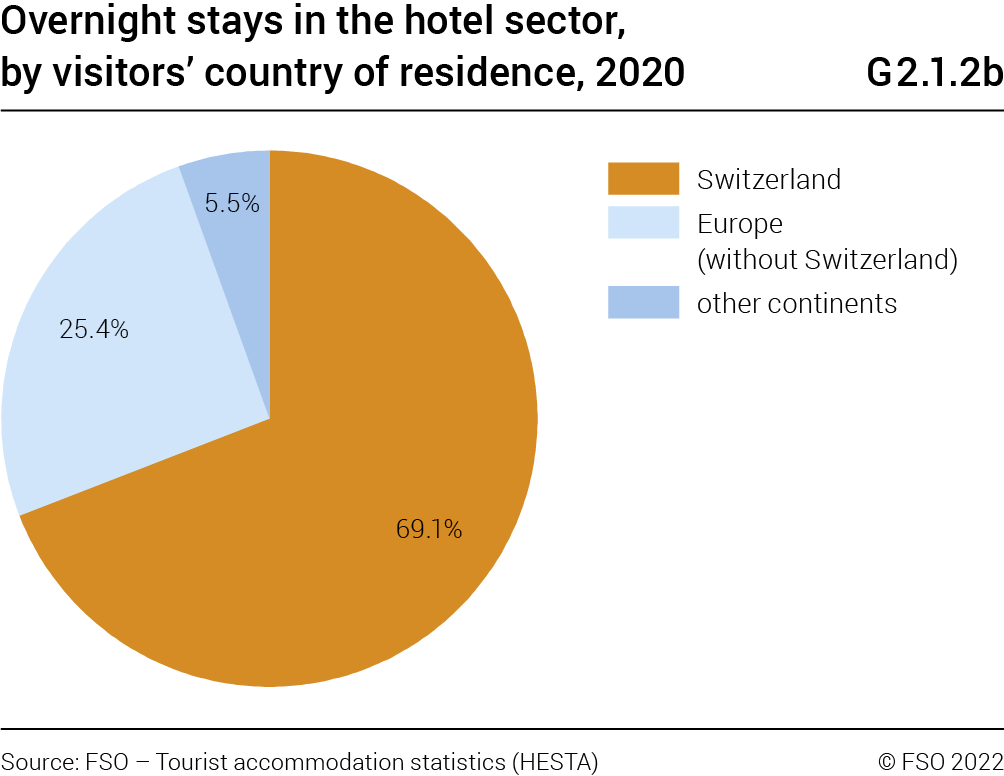
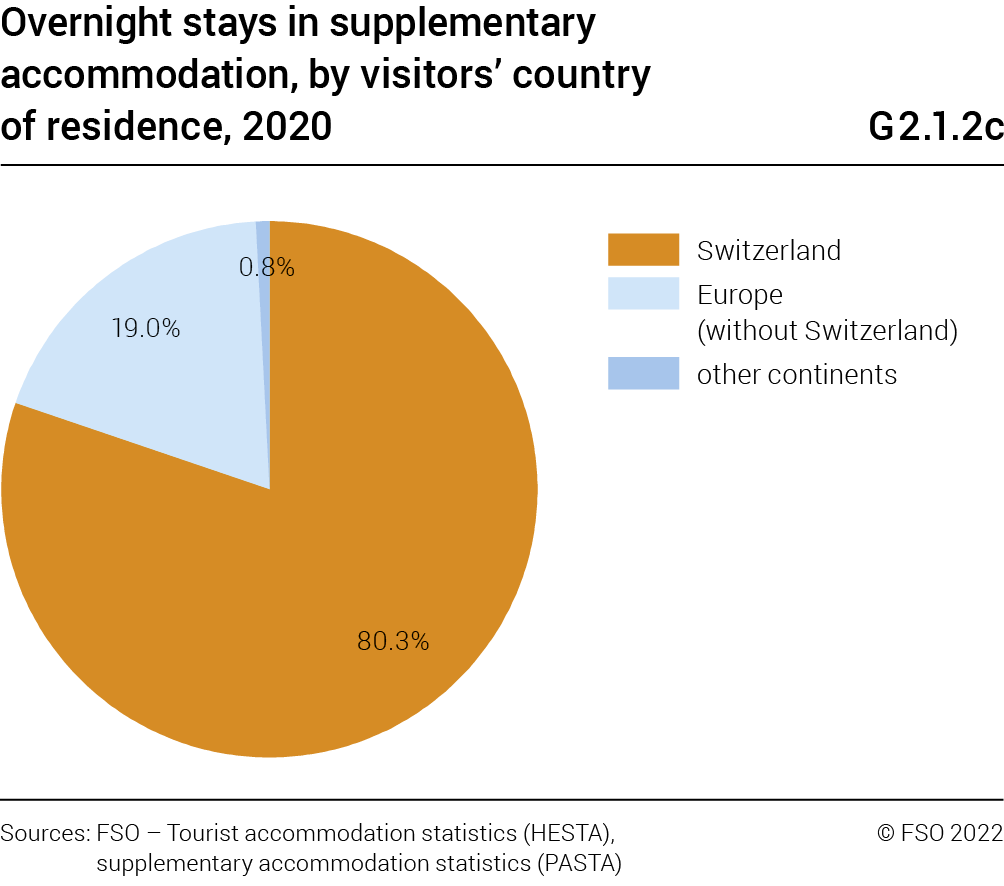
In 2020, Swiss clientele accounted for 73.4% of the overnight stays recorded in Swiss tourist accommodation (G2.1.2a). Despite the exceptional situation in 2020, it declined only slightly (–3.7%) compared with 2019. This was not the case for foreign demand, which experienced a historic fall (–61.9%), with European guests generating the most overnight stays, accounting for 22.9% of total demand. Demand for supplementary accommodation mainly came from Swiss visitors (80.3%) (G2.1.2c). This share was also in the majority in the hotel sector but was slightly lower (69.1%) (G2.1.2b).
Did you know?
The share of non-European overnight stays represented only 3.7% of total demand in 2020 in Swiss tourist accommodation (18.3% in 2019).
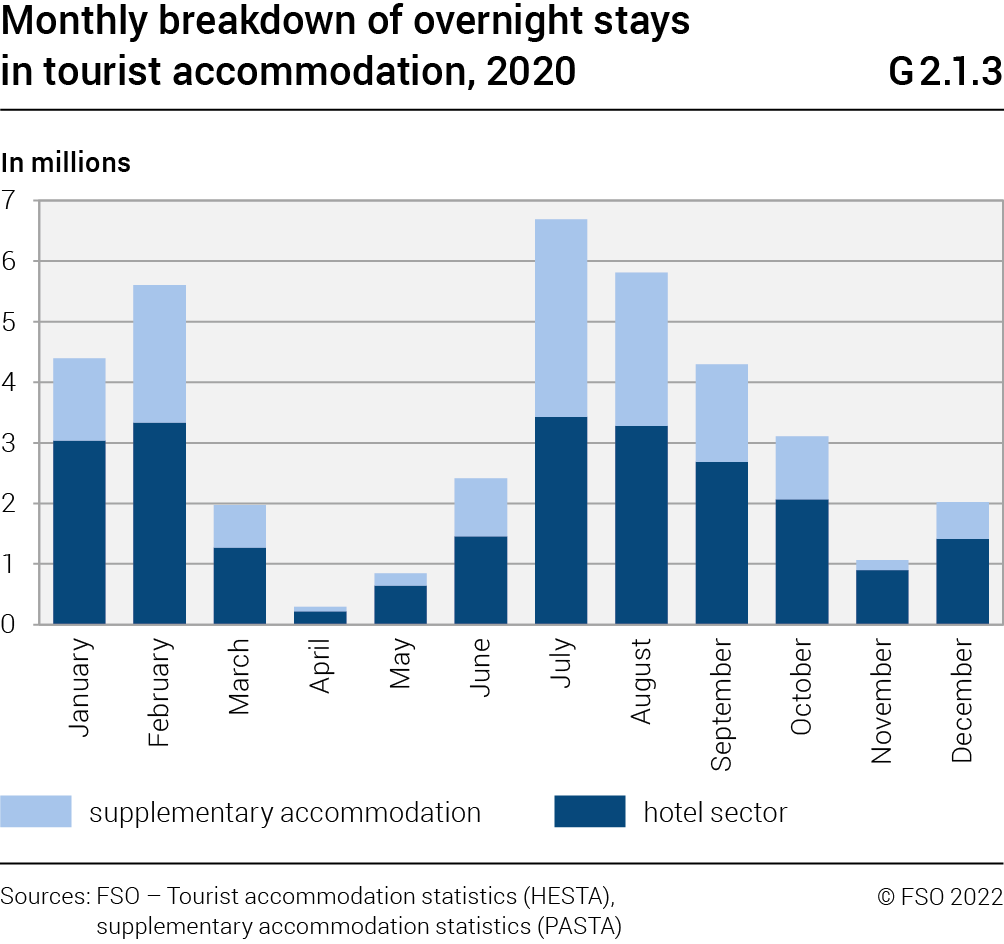
2.1.3 Breakdown for monthly demand
In 2020, March (–62.1%), April (–91.8%) and May (–78.6%) saw historically low numbers of overnight stays compared with 2019. This result is explained by the exceptional context of COVID-19. In tourist accommodation in Switzerland, the greatest number of overnight stays was recorded in the months of July to October (G2.1.3). 19.9 million overnight stays were counted in these four months alone, i.e. 51.7% of the annual demand.
2.1.4 Change in demand in the countries
neighbouring Switzerland
In comparison with the European results (EU), Swiss tourist accommodation in 2020 showed an analogue but nonetheless less marked development in overnight stays (G 2.1.4) with a decrease of 31.5% (versus –50.9% in the EU) in relation to 2019. Switzerland’s neighbouring countries (data not available for France) also experienced strong declines.
In 2020 at European level, the number of overnight stays generated by both non-residents and residents fell (–69.6% and –34.0% respectively, compared with 2019). This trend has also been observed for Switzerland’s neighbouring countries. For Switzerland, the scenario was virtually identical for overnight stays for non-residents with a decline of 61.9%. Demand from residents, however, was almost stable with a slight drop of 3.7%.
2.2 Hotel sector results
2.2.1 Supply in 2020
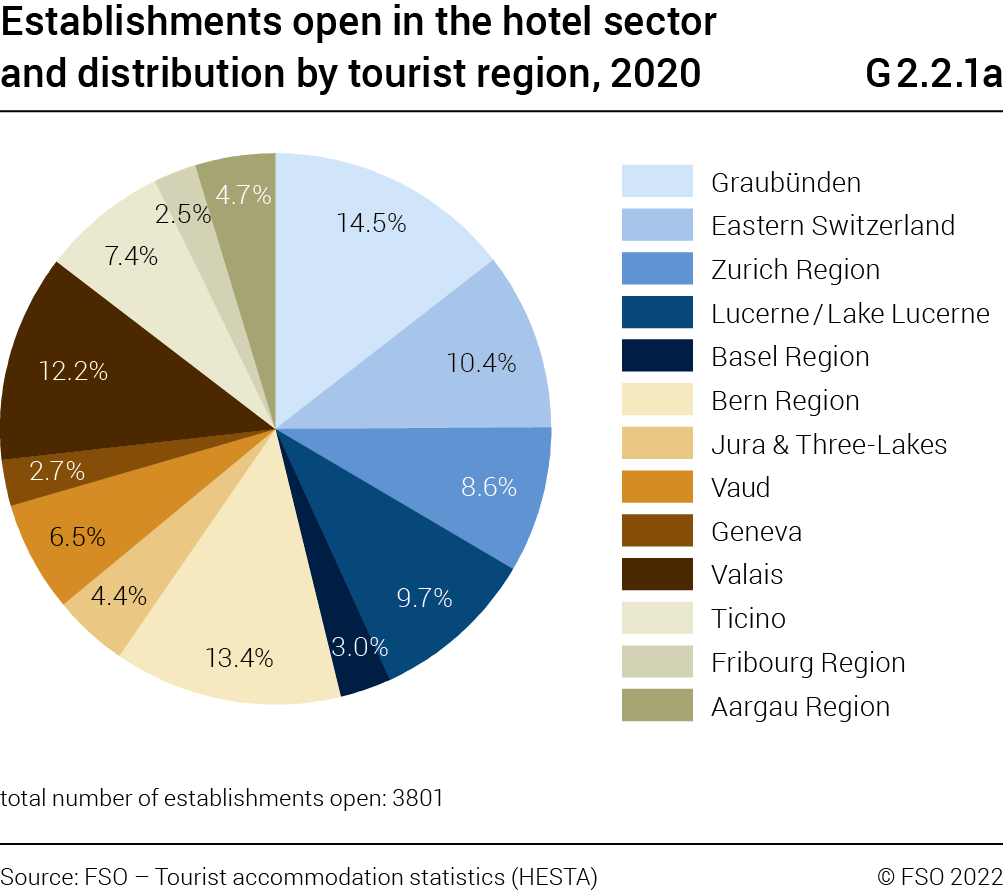
In 2020, there were, on annual average, 3801 open hotels and health establishments in Switzerland, corresponding to 117 630 rooms and 228 641 beds available (G2.2.1a). Due to the COVID-19 crisis, a large number of establishments closed temporarily in 2020. A year earlier there were 4234 establishments open. The distribution of the establishments differed according to the tourist regions. Graubünden had the largest proportion (14.5%), followed by the Bern Region (13.4%). The national average capacity of a hotel establishment was 60.2 available beds (G 2.2.1b).

2.2.2 General change in supply
In 2020, a total of 4646 establishments and 142 656 rooms were surveyed in the hotel sector in Switzerland. The number of establishments remained stable in comparison with 2019 (G2.2.2a), whereas the number of rooms increased (+2325 rooms/+1.7%). Among the tourist regions, the supply, in terms of establishments, grew in 7 in 13 regions between 2019 and 2020. As far as the number of rooms was concerned, 11 in 13 tourist regions followed the same trend as that observed at national level.
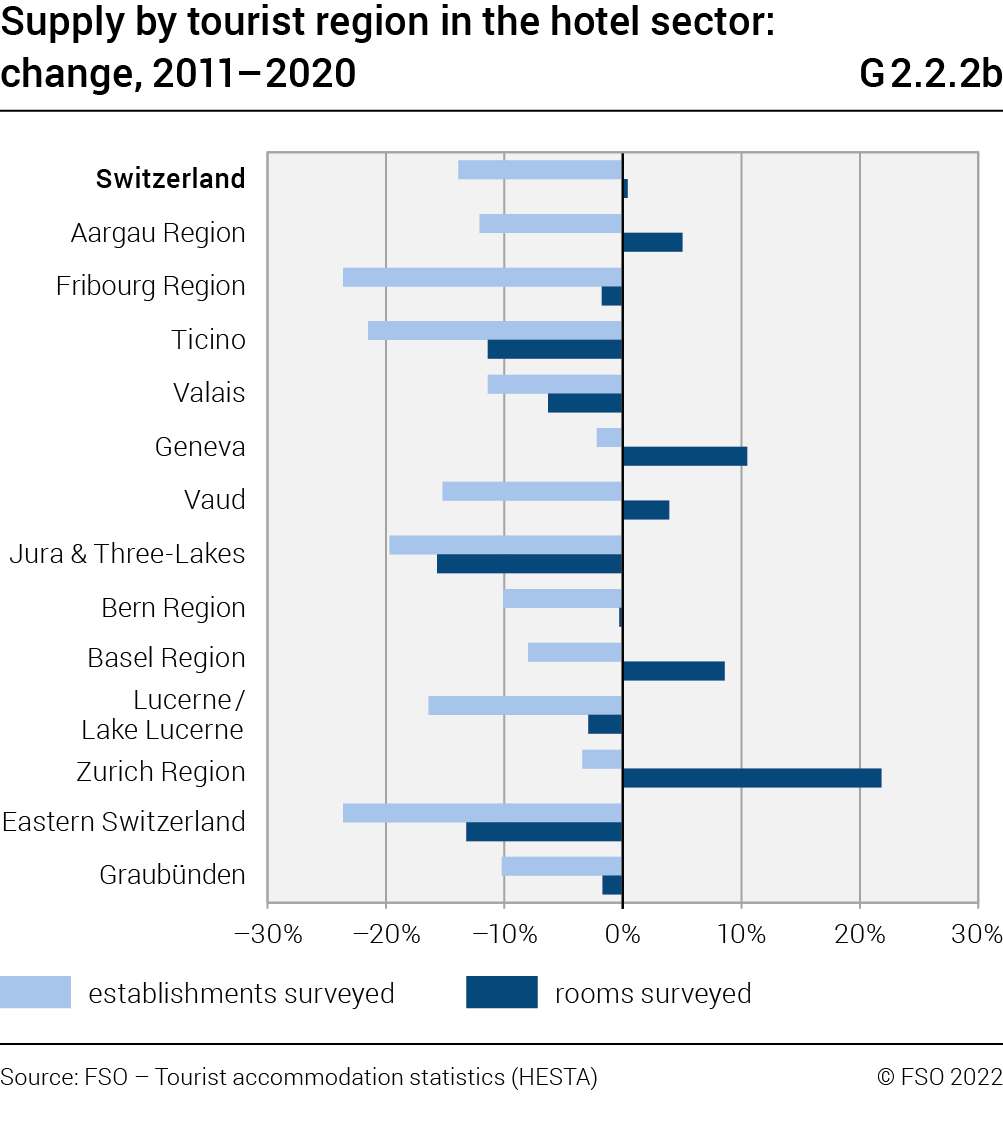
Over a comparative period of 10 years (G2.2.2b), the number of surveyed establishments diminished greatly. Thus in 2011, the number of surveyed establishments totalled 5396 in Switzerland, corresponding in absolute terms to a decline over this period of 751 units (–13.9%). As far as the number of rooms was concerned, a slight increase (+555 rooms / +0.4%) was observed in comparison with 2011. For this period, all the tourist regions saw a decrease in supply for the number of establishments. Eastern Switzerland registered the greatest decline with 144 fewer establishments (–23.6%). As far as rooms are concerned, only five tourist regions show an increase. The Zurich region showed the greatest growth (+3520 rooms/+21.8%). In contrast, the decline was most marked in Eastern Switzerland (–1401 rooms/–13.2%).

Did you know?
Over a 10 year period, the Zurich region saw the number of rooms surveyed increase by over 21.8% (+3520 rooms).
2.2.3 General trend in demand
To better appreciate the results of demand in the hotel sector in Switzerland, these should be correlated with the striking economic events and other crises (such as health crises) which have occurred over the past ten years.
The effects of the global economic crisis in 2009 had an impact on demand in the years that followed. 2011 was characterised by a strong rise in the Swiss franc's value against the Euro and other currencies. On 6th September 2011, the introduction of the minimum exchange rate by the Swiss National Bank (SNB) stabilised exchange rates, which nonetheless remained far lower than in previous years. On 15th January 2015, the SNB announced the end of the minimum exchange rate, resulting in renewed strength of the Euro compared with the Swiss franc. In the following two years, although the Swiss franc regained some ground against the Euro it never reached its pre-2015 level. By the end of February 2020, the health crisis completely disrupted society and the economy. Both the national and international tourism sectors were very negatively affected by this exceptional situation.
Over the past ten years, the evolution in the total number of overnight stays in hotels and health establishments in Switzerland has been diverse (G2.2.3). The number of overnight stays decreased in 2011 and 2012 (–2.0% for each year). The trend was reversed for the years 2013 (+2.5%) and 2014 (+0.9%), however renewed decreases were observed for the years 2015 (–0.8%) and 2016 (–0.3%) A strong improvement in demand was seen in 2017 (+5.2%) which continued in 2018 (+3.8%) and in 2019 (+1.9%) with a total of 39.6 million overnight stays recorded, i.e. a level never observed until now. In 2020, demand fell by a historic 40.0% to 23.7 million overnight stays. For the same year, with the exception of January (+7.1) and February (+7.0), very sharp monthly falls could be observed, ranging from –91.8% in April to –24.9% in July.

Did you know?
The number of overnight stays fell by 15.8 million units in 2020.
2.2.4 Change in domestic and foreign demand
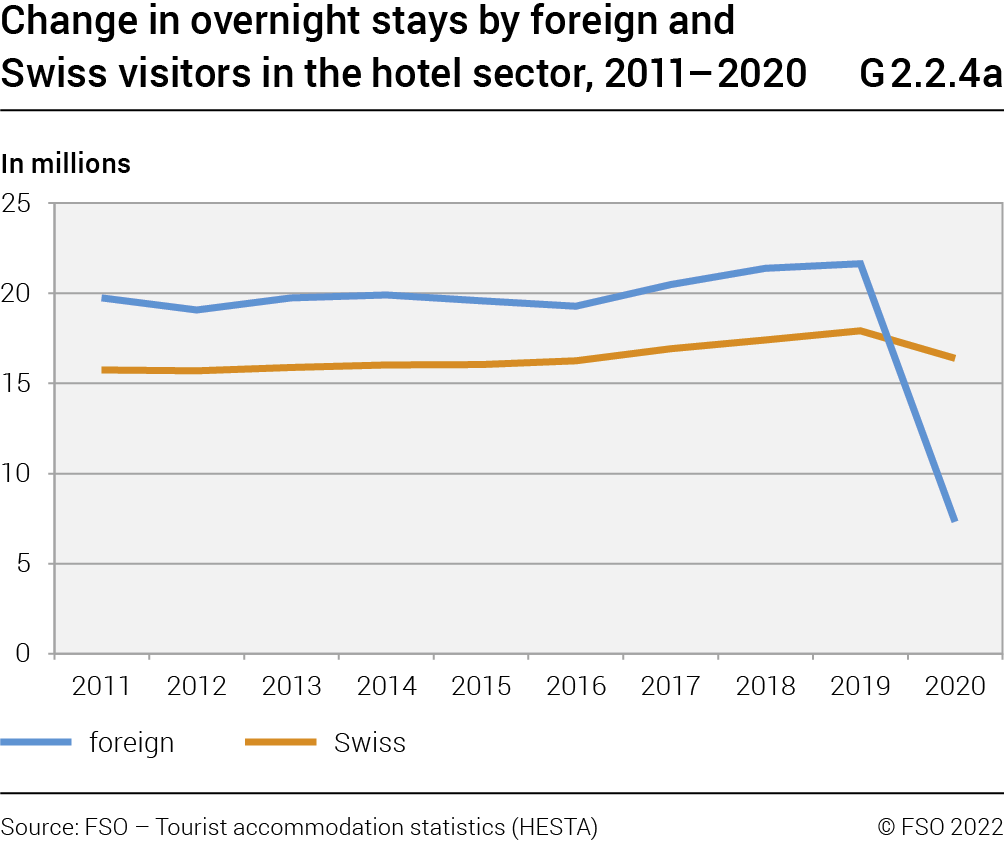
Looking back on the past 10 years, foreign and domestic demand in the hotel sector has not always followed similar trends (G2.2.4a). In 2011 and 2012, differences were seen between both types of demand. On the one hand, domestic demand was quite stable although foreign demand showed a decrease (2011; –3.5%/2012; –3.3%). In 2013, however, a positive trend was observed for both types of demand. This continued in 2014. Although the increase in overnight stays for Swiss clientele continued in 2015 and 2016, demand from foreign clientele saw a decline once again. In 2017 and 2018 both foreign and domestic demand increased. This situation continued in 2019. Indeed, a rise of 1.1% was registered for foreign visitors and of 2.9% for Swiss visitors. The total overnight stays by foreign guests (21.6 million) as well as those by domestic guests (17.9 million) reached record levels in 2019. In 2020, foreign demand fell drastically to 7.3 million overnight stays (–66.1%), while domestic demand totalled 16.4 million overnight stays, which is a significant (–8.6%/–1.5 million) but less drastic decline.
In January and February 2020, both foreign and Swiss overnight stays increased (G2.2.4b). In March, foreign demand collapsed (–68.2%) and followed this trend throughout 2020. Decreases ranged from –96.2% (April) to –60.9% (August). Overnight stays by Swiss guests also fell drastically in March (–55.4%), April (–86.2%) and May (–54.6%). In June, domestic demand remained strongly negative (–23.1%) but nonetheless showed an improvement compared with the previous three months. From July to October, a sharp inversion of this trend was observed for this clientele. Unprecedented levels of Swiss demand were recorded every month during this period. Monthly increases during this period ranged from +35.0% (July) to +16.4% (October). However, from November onwards (–29.1%) and then in December (–17.2%), domestic demand fell once again though it did not reach the negative level seen between March and May.
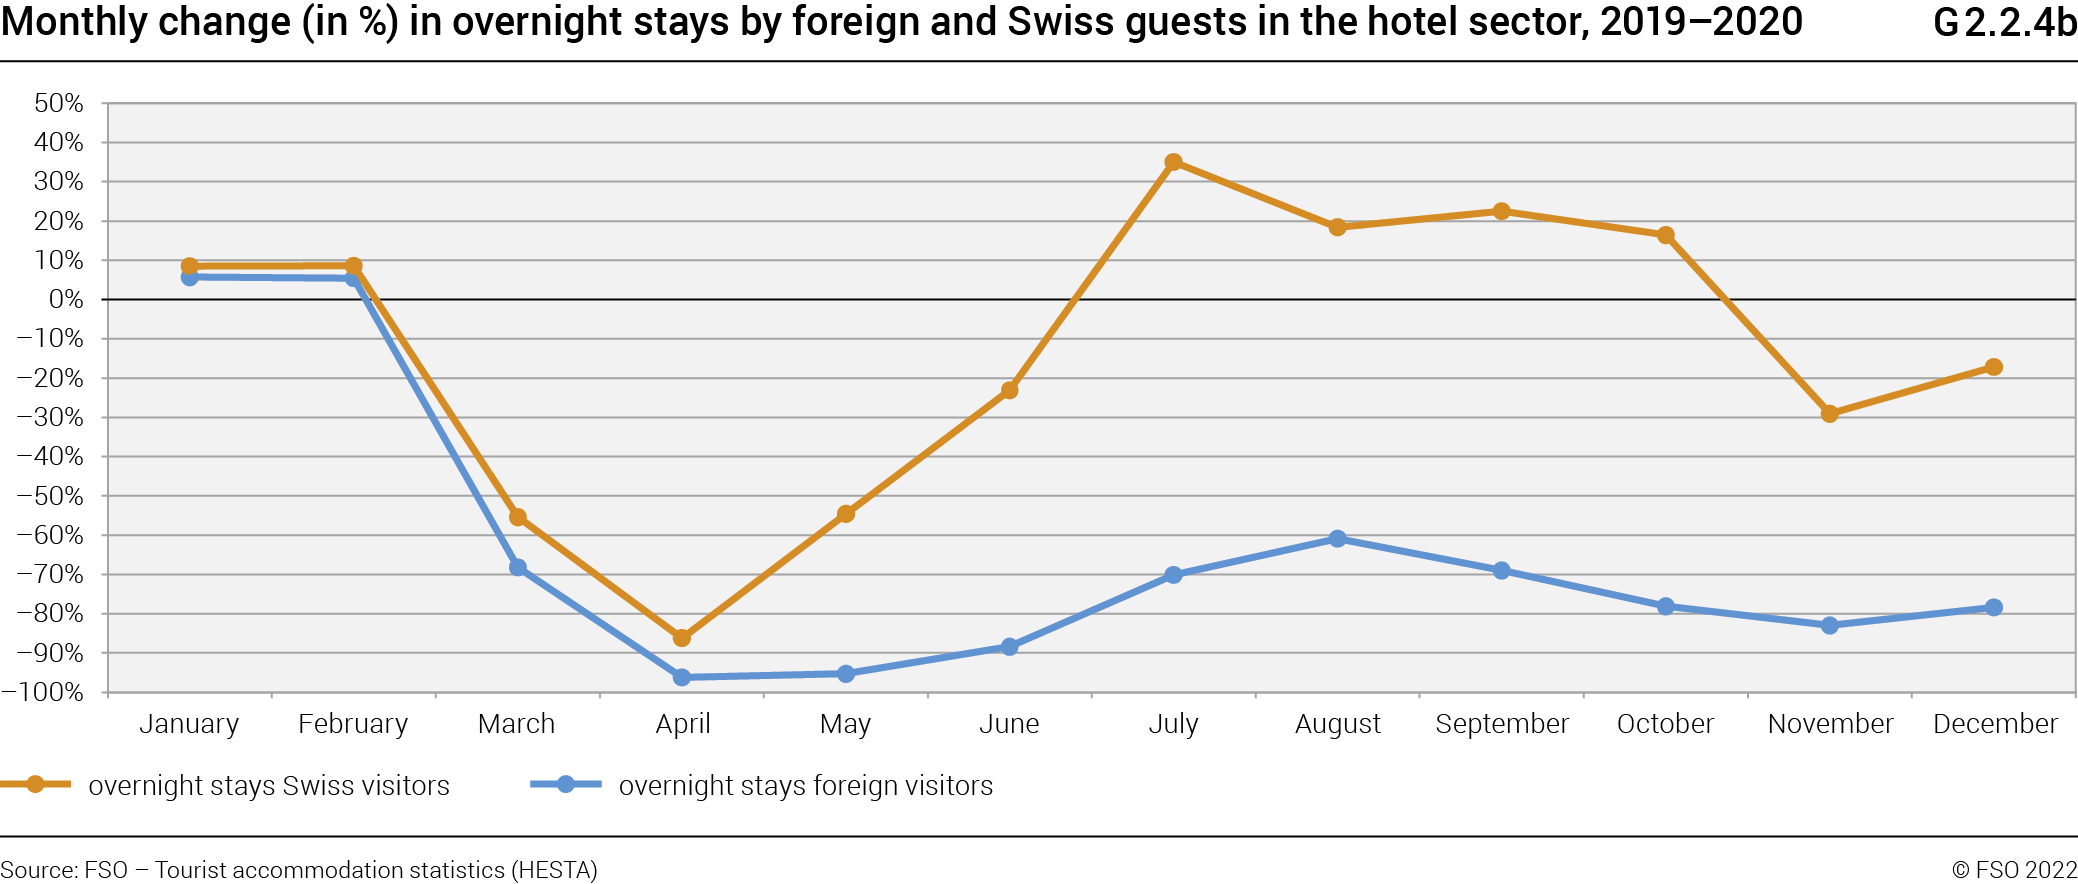
Did you know?
Between July and September 2020, Swiss demand reached record levels with over 2.0 million overnight stays per month.
2.2.5 Change in demand by continent
of origin of guests
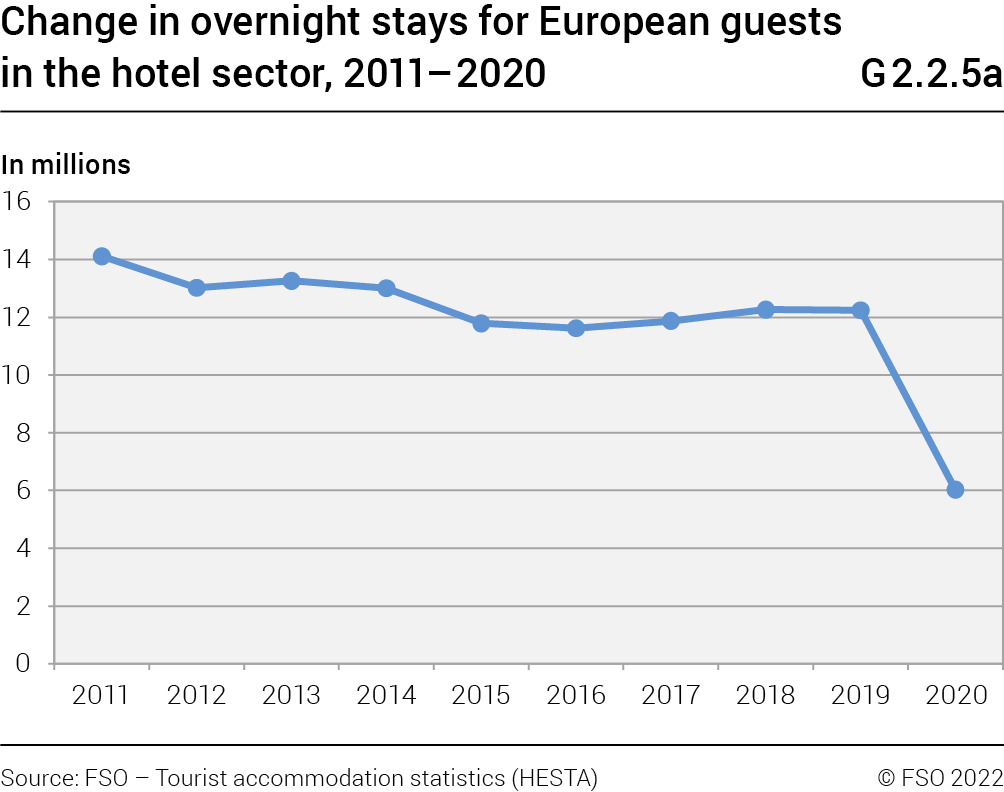
In 2020, demand from Europe (excluding Switzerland) registered 6.0 million overnight stays, representing a decline of 50.7% (–6.2 million overnight stays) compared with 2019 (G2.2.5a). Even if this drastic fall is linked to the health situation, demand from this continent was already on a negative trend between 2011 and 2016, and then stagnated until 2019. In fact, overnight stays by these visitors fell between 2011 and 2019 by 13.3%.
In 2020, demand from Asian visitors in the hotel sector also, unsurprisingly, saw a historic fall (G2.2.5c). A total of 587 000 overnight stays were observed for this clientele in 2020, a decrease of 89.2% (–4.9 million overnight stays) compared with 2019. This result brings to an end a decade marked - generally speaking - by strong annual growth. It should be noted, however, that a slight "slowdown" in demand was observed in 2019 (+0.4%).
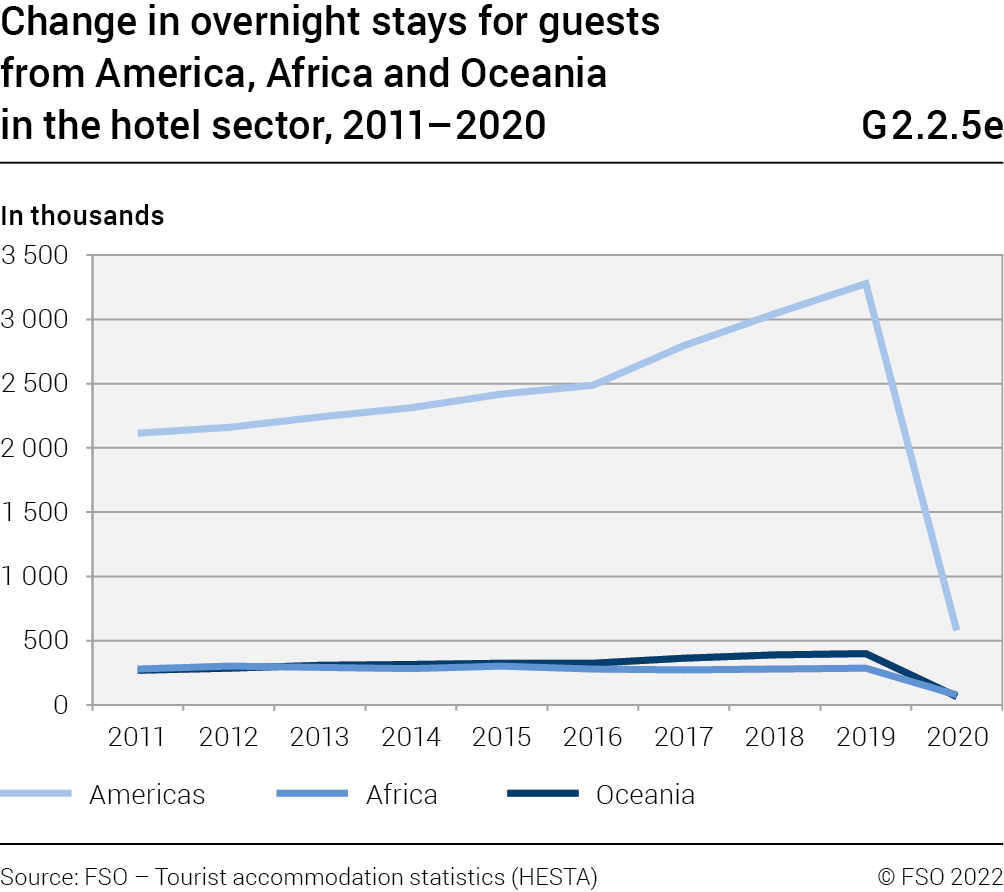
Finally, the situation was strongly negative for demand from visitors from the American continent which registered a total 580 000 overnight stays in 2020, i.e. a decline of 82.3% compared with 2019 (G2.2.5e). In 2020, visitors from Oceania posted 67 000 overnight stays (–83.2%) and those from Africa 80 000 units (–72.1%).


Did you know?
Overnight stays by visitors from China fell by 91.4% from 1.4 million in 2019 to 119 000 in 2020.
2.2.6 Change in demand by tourist region
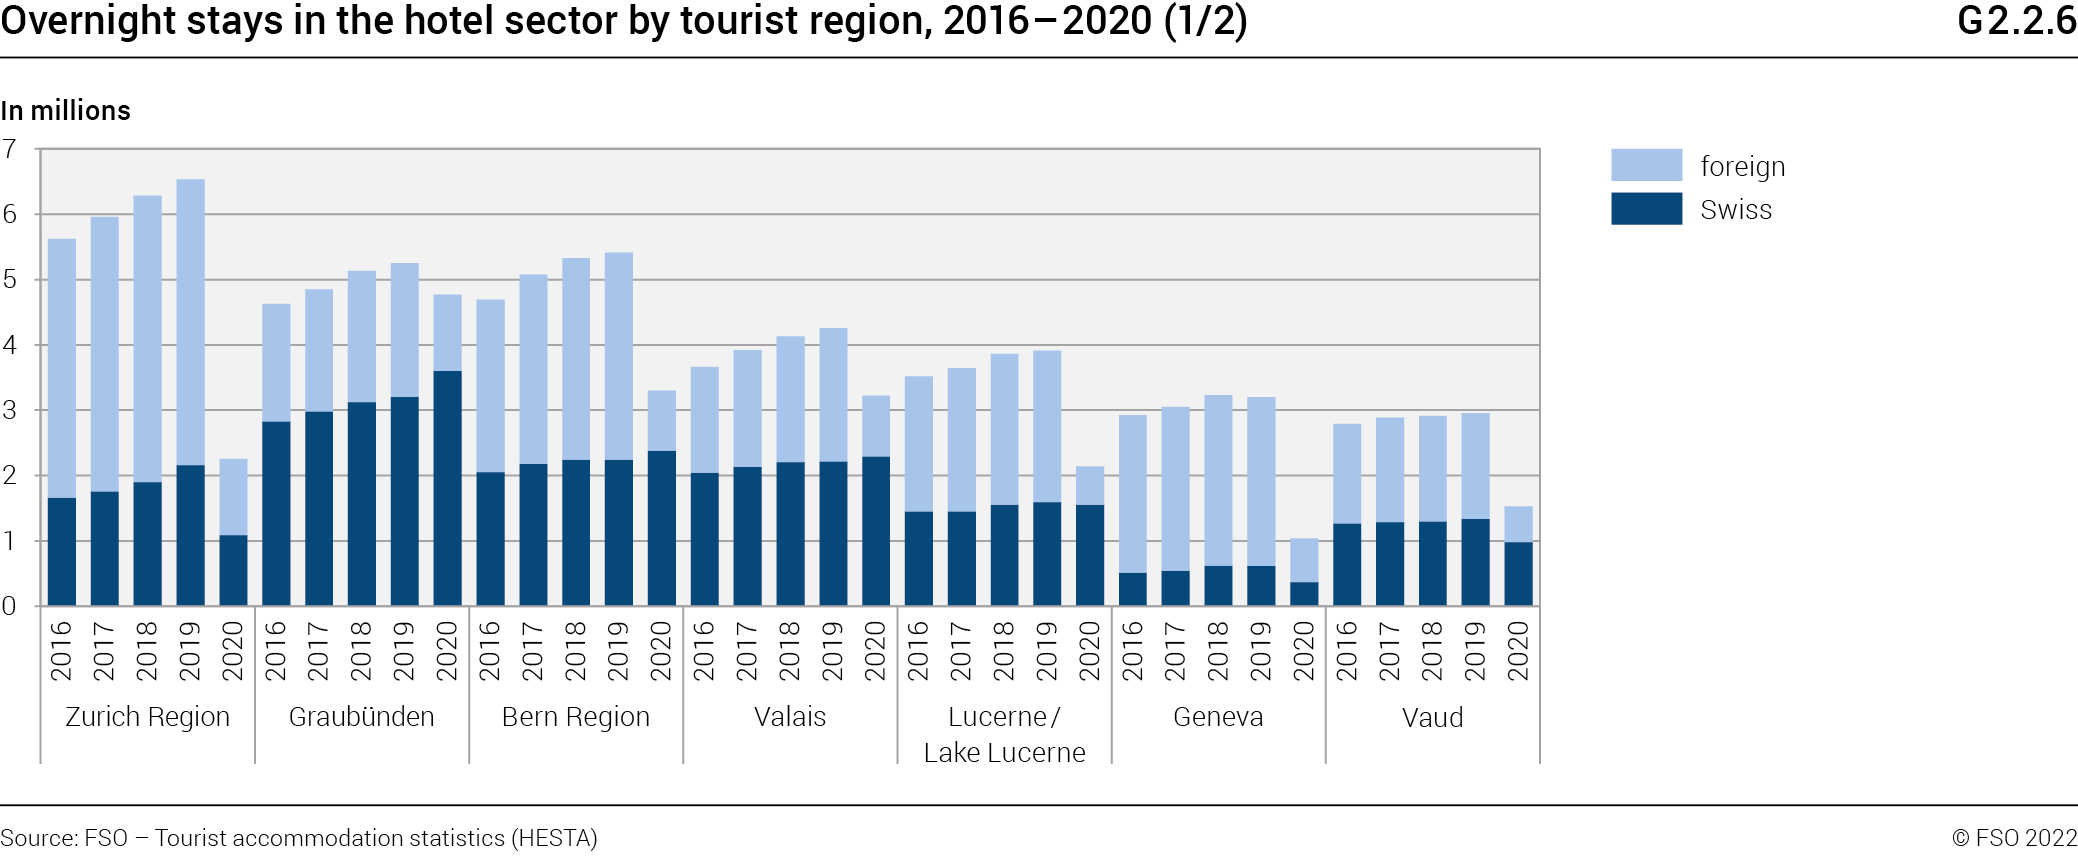
In 2020, Switzerland’s thirteen tourist regions observed declines in overnight stays compared with 2019 (G2.2.6). The largest declines were observed in city regions. Geneva (–67.5%), the Zurich Region (–65.4%) and the Basel Region (–58.8%) posted the largest contractions in demand among all regions. This is a radical change for these regions, which have regularly experienced sharp increases in recent years. For the other tourist regions, the smallest declines in 2020 were recorded in Graubünden (–9.2%) and Ticino (–16.3%).
All tourist regions observed extremely marked drops in foreign demand in 2020, ranging from –74.9% (Lucerne/Lake Lucerne region) and –42.8% (Graubünden). In terms of Swiss demand, however, four regions saw an increase in overnight stays. These were Graubünden (+12.2%), Ticino (+9.7%), the Bern Region (+6.4%) and Valais (+3.5%). The other nine tourist regions saw a decline in domestic demand, but less markedly than for foreign clientele. The declines ranged from –49.6% (Zurich Region) and –2.3% (Lucerne/Lake Lucerne region).

Did you know?
Between June and December 2020, Swiss demand in Graubünden increased by 34.2% (+616 000 overnight stays) compared with 2019.
2.2.7 Duration of stay
In 2020, visitors stayed an average of 2.22 nights in hotels and health establishments in Switzerland. This duration was, however, longer for foreign visitors (2.44 nights) than for Swiss visitors (2.13 nights).
These results for 2020 contrast with the trend over the past ten years in which the length of stay at national level has gradually decreased (G2.2.7a). This is mainly due to the fact that the native population favoured summer and autumn holidays in Switzerland in view of the international situation and restrictive measures.
Among the tourist regions, Graubünden recorded the longest stay in 2020 with 2.87 nights (G2.2.7b). In contrast, the shortest length of stay was observed in the region of Fribourg (1.69 nights). At national level, too, the length of stay was longer for foreign clientele than for domestic visitors in the majority of tourist regions. The greatest difference was observed in Graubünden where foreign visitors stayed for an average of 3.68 nights whereas Swiss visitors stayed for 2.67 nights.

2.2.8 Occupancy rate of rooms
In 2020, the net room occupancy rate in hotels and health establishments was 36.1% nationally (G2.2.8). It is the lowest rate recorded since the start of observation of this variable (2005). It stood at 55.2% in 2019 and has grown strongly since 2016. This rate varied considerably depending on the tourist region.
This rate declined in all tourist regions, but it was in the city regions where the largest declines and the lowest rates were observed. Geneva registered a rate of 26.6%, the lowest of all tourist regions. This was followed by the region of Zurich with a rate of 27.2% (65.0% in 2019). For their part, the tourist regions in the mountains posted slightly lower rates compared with the previous year. Valais reached a rate of 48.1% (53.9% in 2019) i.e. the highest of all the tourist regions, followed by Graubünden with 47.2% (50.2% in 2019).
Did you know?
In 2019, Geneva had the highest net room occupancy rate in Switzerland at 66.5%. This fell by 39.9 points in 2020.
2.2.9 Change in demand in the countries
neighbouring Switzerland
In the EU in 2020, overnight stays in the hotel sector fell by 57.4% (G2.2.9). A decrease was also seen in Switzerland (–40.0%) and in the countries neighbouring Switzerland (2020 data not available for France).
Overnight stays by residents (–40.9%) and non-residents (–73.2%) fell in the EU and in the countries neighbouring Switzerland. In Switzerland, overnight stays by residents showed a moderate decline of 8.6% whereas overnight stays by non-residents fell sharply (–66.1%).


2.3 Supplementary accommodation results
In the supplementary accommodation sector, the statistic covers three main types of accommodation: commercially-run holiday homes, collective accommodation and campsites. In order to present information from the supplementary accommodation sector as comprehensively as possible, the results are broken down by each type of accommodation.
2.3.1 Supply in supplementary accommodation
A) Holiday homes
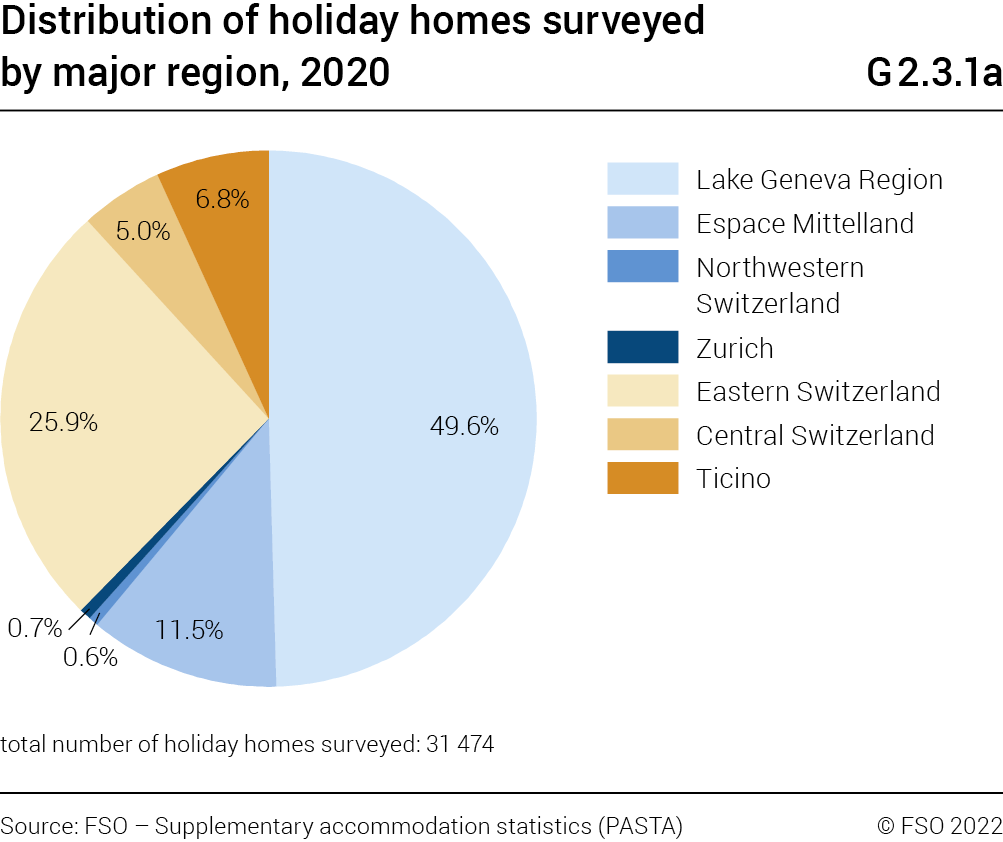
In 2020, a total of 31 474 commercially run holiday homes were counted in Switzerland (G2.3.1a). In terms of beds, this represented a capacity of 153 563 units. If we consider the distribution of holiday homes by Switzerland’s seven major regions, the Lake Geneva Region has the largest share with 49.6% of the total. This was followed by Eastern Switzerland with a share of 25.9%.
B) Collective accommodation
At national level, there were 2393 collective accommodation units, i.e. a total of 114 125 beds were surveyed for the year 2020 (G2.3.1b). At major region level, Espace Mittelland had the greatest share of establishments (26.9%) closely followed by Eastern Switzerland (25.8%) and the Lake Geneva region (23.9%).
C) Campsites
The total number of campsites surveyed in Switzerland in 2020 was 396, i.e. 28 701 rental pitches for passing guests (G2.3.1c). In terms of distribution at major region level, Espace Mittelland (27.8%) and the Lake Geneva region (25.0%) recorded the largest number of establishments.


2.3.2 Demand in supplementary accommodation
A) Holiday homes
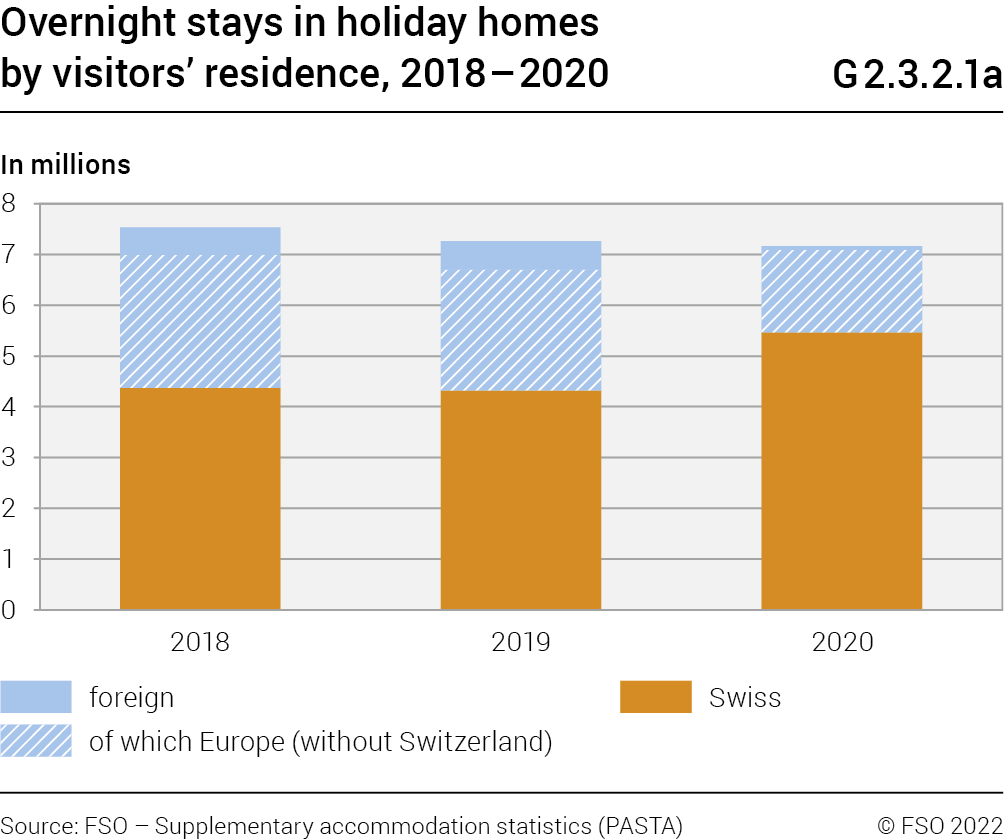
In 2020, overnight stays registered in holiday homes reached a total of 7.2 million nationally, i.e. a decrease of 1.3% compared with 2019 (G2.3.2.1a). Swiss guests generated 5.5 million overnight stays (+26.4%). Foreign clientele accounted for 1.7 million units (–42.2%) of which more than 95% came from European visitors. At major region level, the Lake Geneva Region counted the greatest number of overnight stays in 2020 with a total of 2.8 million units (G2.3.2.2a).
B) Collective accommodation
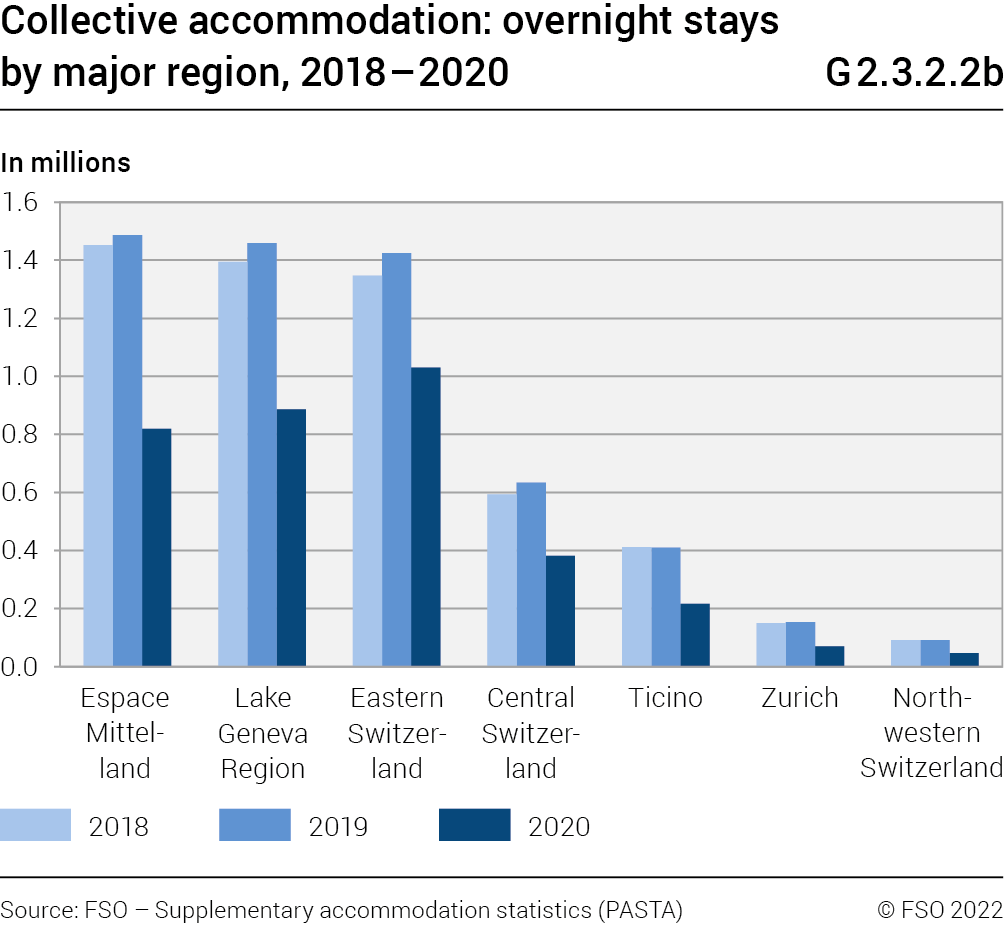
Demand for collective accommodation was strongly affected by the COVID-19 pandemic. A total of 3.4 million overnight stays were recorded for 2020, a drastic drop of 39.0% compared with the previous year (G2.3.2.1b). Swiss visitors accounted for the largest share of overnight stays with 3.0 million units (–34.3%). Foreign demand totalled 450 000 overnight stays (–58.8%). European visitors generated more than 90% of these stays. Eastern Switzerland (G2.3.2.2b) was the major region with the most overnight stays (1.0 million).
C) Campsites
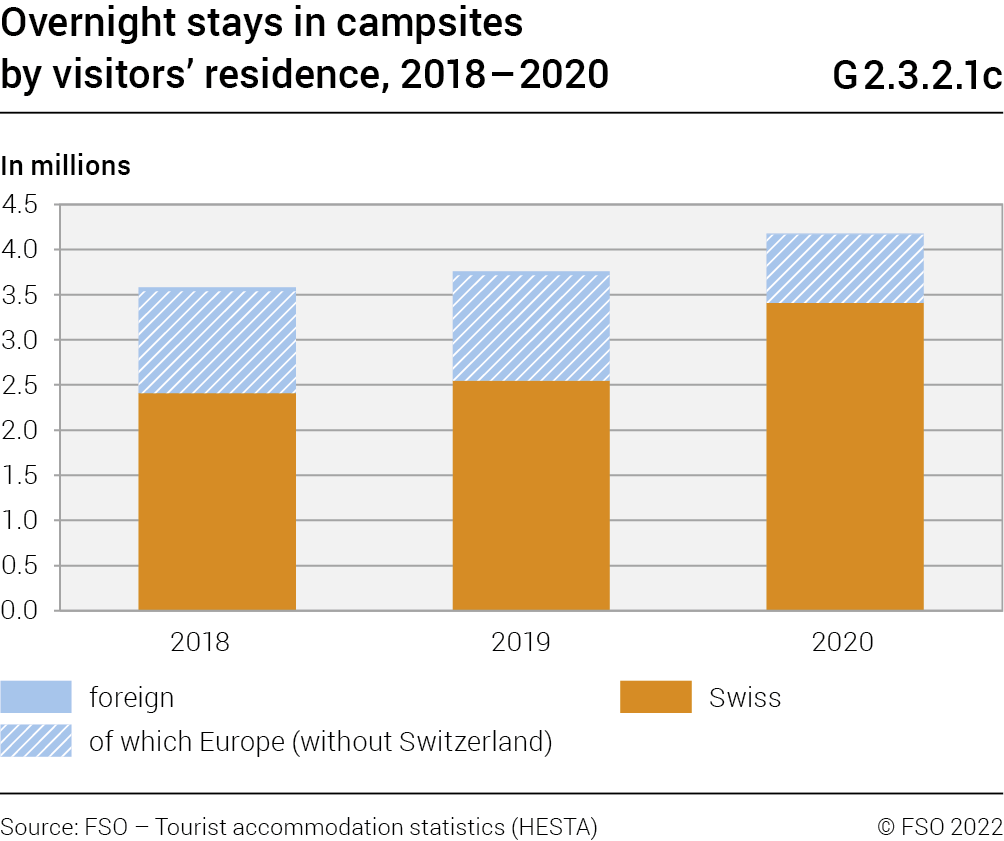
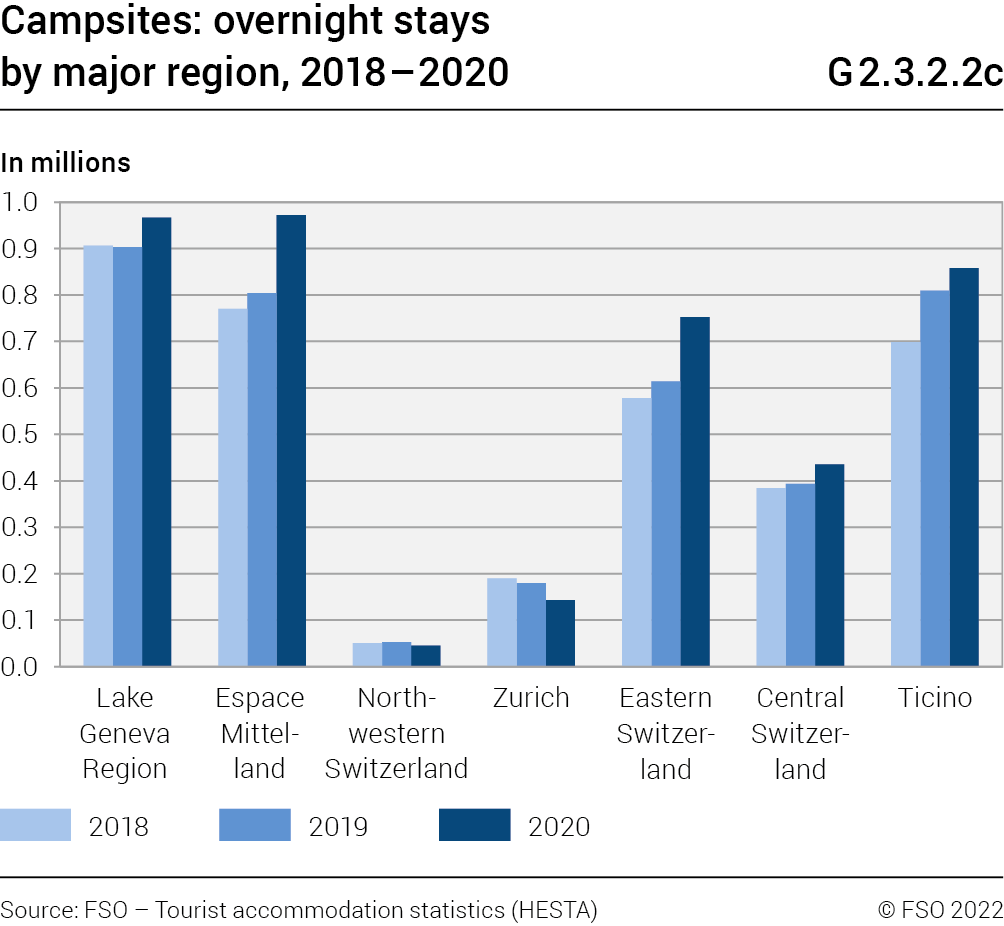
With 4.2 million overnight stays, campsites recorded an 11.1% increase in overnight stays in 2020 compared with the previous year - despite the closure imposed by the authorities in the spring (G2.3.2.1c). 3.4 million overnight stays could be attributed to Swiss clientele (+33.9%) and 766 000 to foreign visitors (–36.8%). It should be noted that 99.3% of these foreign visitors came from Europe. Espace Mittelland recorded the greatest number of overnight stays with 973 000 units. It was followed by the Lake Geneva region with 967 000 units (G2.3.2.2c).


Did you know?
Overnight stays at campsites between July and October 2020 increased by 33.1% compared with the same period in 2019
2.3.3 Breakdown for monthly demand
A) Holiday homes
Visits in terms of overnight stays to holiday homes (G2.3.3a) is concentrated mainly in January and February (34.8% of annual demand) and in July and August (29.2%). April represented only 0.6% of the total demand.
Did you know?
In holiday homes, February alone accounted for 22.6% of the annual number of overnight stays in 2020.
B) Collective accommodation
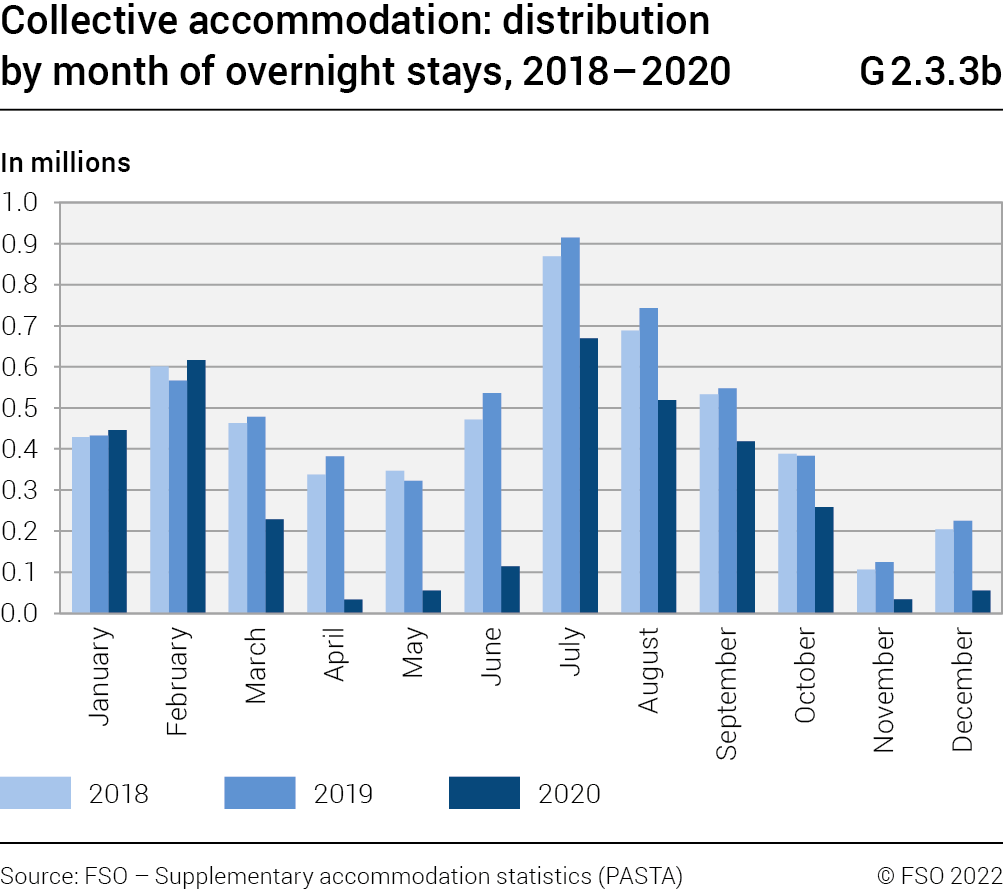
The monthly breakdown of demand in collective accommodation in 2020 highlighted the fact that overnight stays were mainly generated in summer, more precisely between July and September (G2.3.3b). The share from these three summer months represented 46.6% of the annual overnight stays with a peak in July (19.4% of the 2020 total). The January–February period, still exempt from the COVID-19 measures, also showed a significant number of overnight stays with a share of 30.8% of the annual demand.
C) Campsites
Highly seasonal and with a closure imposed by the authorities in the spring due to COVID-19, demand for campsites was, unsurprisingly, almost entirely concentrated in the summer period (G2.3.3c). Almost 90% of overnight stays (88.9%) were recorded between June and September.

2.3.4 Duration of stay in supplementary
accommodation
A) Holiday homes
The average length of stay in holiday homes in Switzerland reached 6.60 nights in 2020 (6.47 in 2019) (G2.3.4a). However, this value varied by major region. Indeed, in Eastern Switzerland it was 7.00 nights (7.02) and in the Lake Geneva region it was 6.62 nights (6.66), i.e. the longest durations at this regional level. In contrast, the Northwest Switzerland region registered the shortest value with 5.05 nights (4.36).
B) Collective accommodation
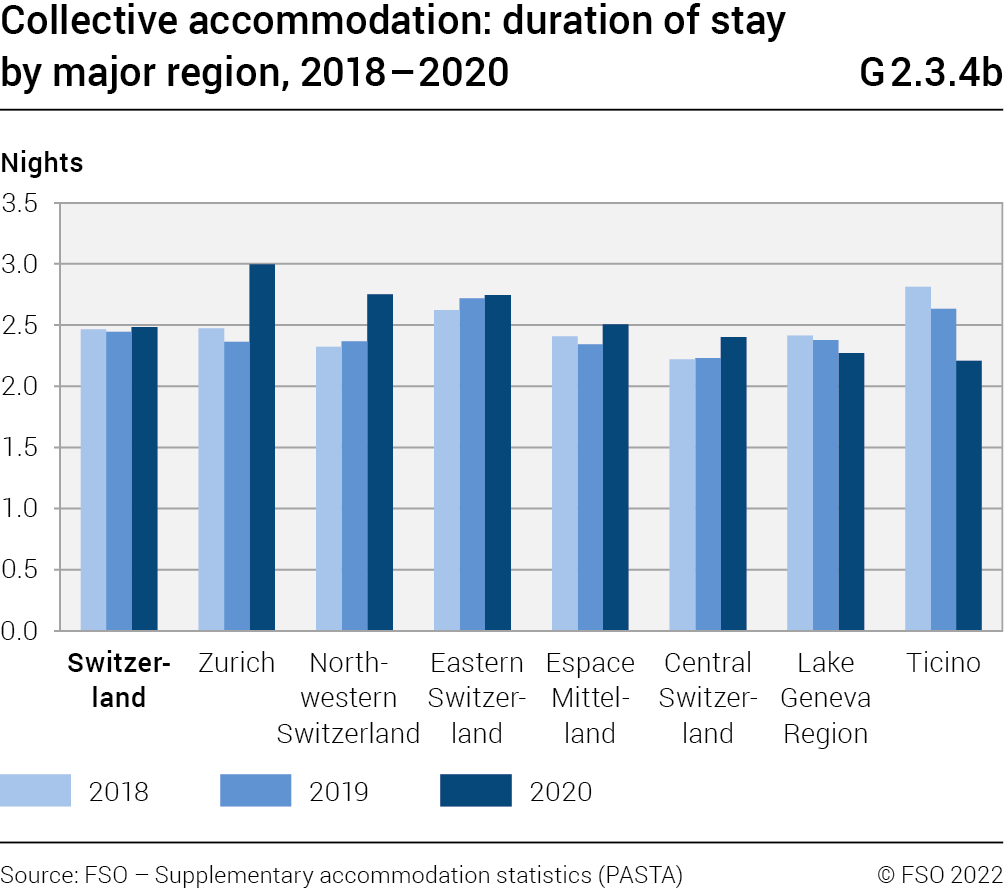
In 2020, the average length of stay in collective accommodation nationally was 2.48 nights (2.45 in 2019) (G2.3.4b). Among the major regions, Zurich registered the longest stay with 3.00 nights (2.36). Conversely, the shortest length of stay was seen in Ticino with 2.21 overnight stays (2.63).
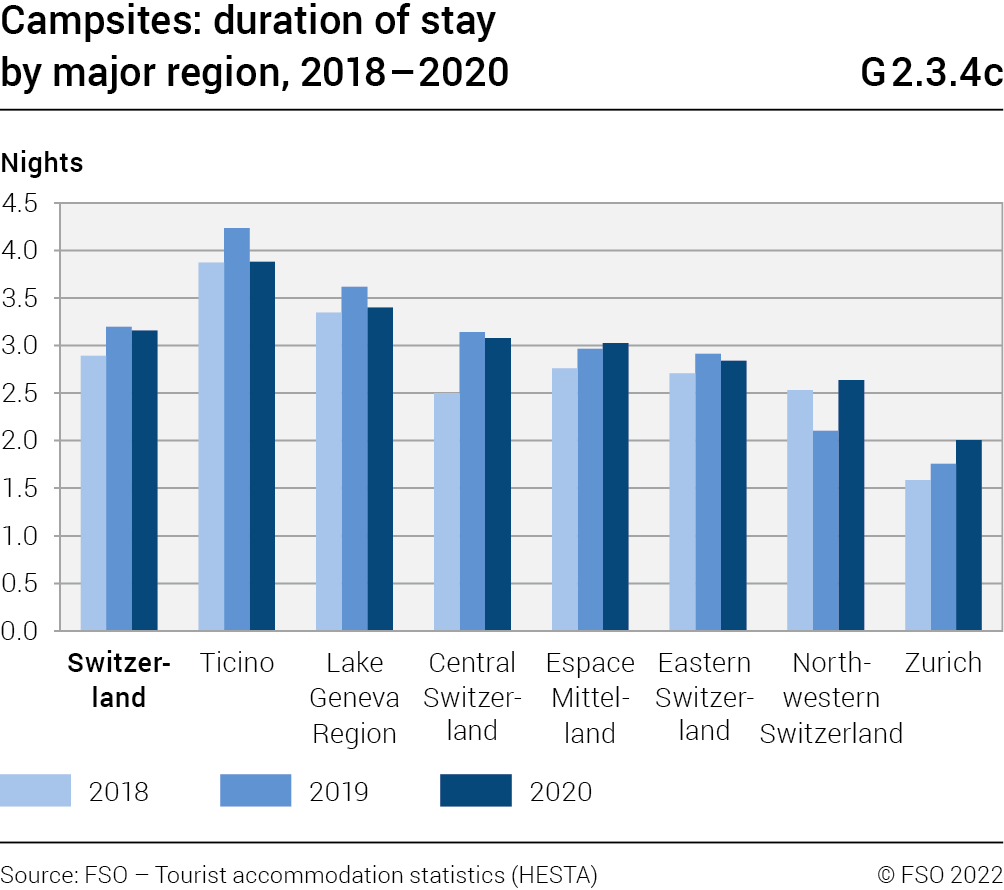
C) Campsites
For campsites, the average length of stay in 2020 was 3.16 nights (3.20 in 2019) for Swiss territory (G2.3.4c). This duration reached 3.88 nights (4.23) in Ticino, i.e. the highest among all the major regions. The shortest length of stay was in Zurich with 2.00 nights (1.76).

2.3.5 Change in demand in the countries
neighbouring Switzerland
The trend in overnight stays in the EU in the supplementary accommodation sector fell by 39.1% (G2.3.5). Switzerland recorded a drop in demand of 11.3%, a smaller decrease than that of the EU and the countries neighbouring Switzerland (2020 data not available for France).
Overnight stays by residents of the EU decreased by 23.7% and those of non-residents by 61.4%. For both Switzerland (–44.4%) and its neighbouring countries, demand from non-residents showed marked decreases. While demand from residents of neighbouring countries also fell considerably, Switzerland managed to record an increase of 3.8%.
