Comments on findings for the period 2015–2021
Labour market indicators for 2021
This document is an extract from the publication “Labour market indicators 2021” (available in German and French), which presents the main highlights among the vast range of employment data. The information is arranged to provide an overview of the Swiss labour market, along with the relevant statistics. Some of the areas dealt with include employment, working hours, unemployment, vacancies, dynamic aspects of the labour market, as well as salary structure and trends.
The first part of the publication is devoted to comments on the findings for the period 2015–2021. It then looks at the definitions of the main labour market indicators. There is then a specific chapter describing the methodological aspects of the various statistical sources. The final part of this publication includes tables presenting in detail the results of the various labour market statistics.
FSO number: 206-2101 (German),
206-2102 (French)
Orders: Tel. +41 58 463 60 60, Fax +41 58 463 60 61,
order@bfs.admin.ch
Abbreviations in the graphs
ES → Employment Statistics
ESS → Swiss Earnings Structure Survey
EUROSTAT → Statistical office of the European Union
GDP → Gross domestic product
JOBSTAT → Job Statistics
LMA → Labour Market Accounts
SECO → State Secretariat for Economic Affairs
SLFS → Swiss Labour Force Survey
SWI → Swiss Wage Index
WV → Work Volume Statistics
Table of contents
2015– 2020: Major developments in the Swiss labour market
2015– 2020: The situation of men and women in the labour market
2015–2020: Swiss and foreign labour force
2015–2020: Working conditions in Switzerland
Labour market in the first quarter of 2021 and short-term prospects
The Swiss labour market in international comparison
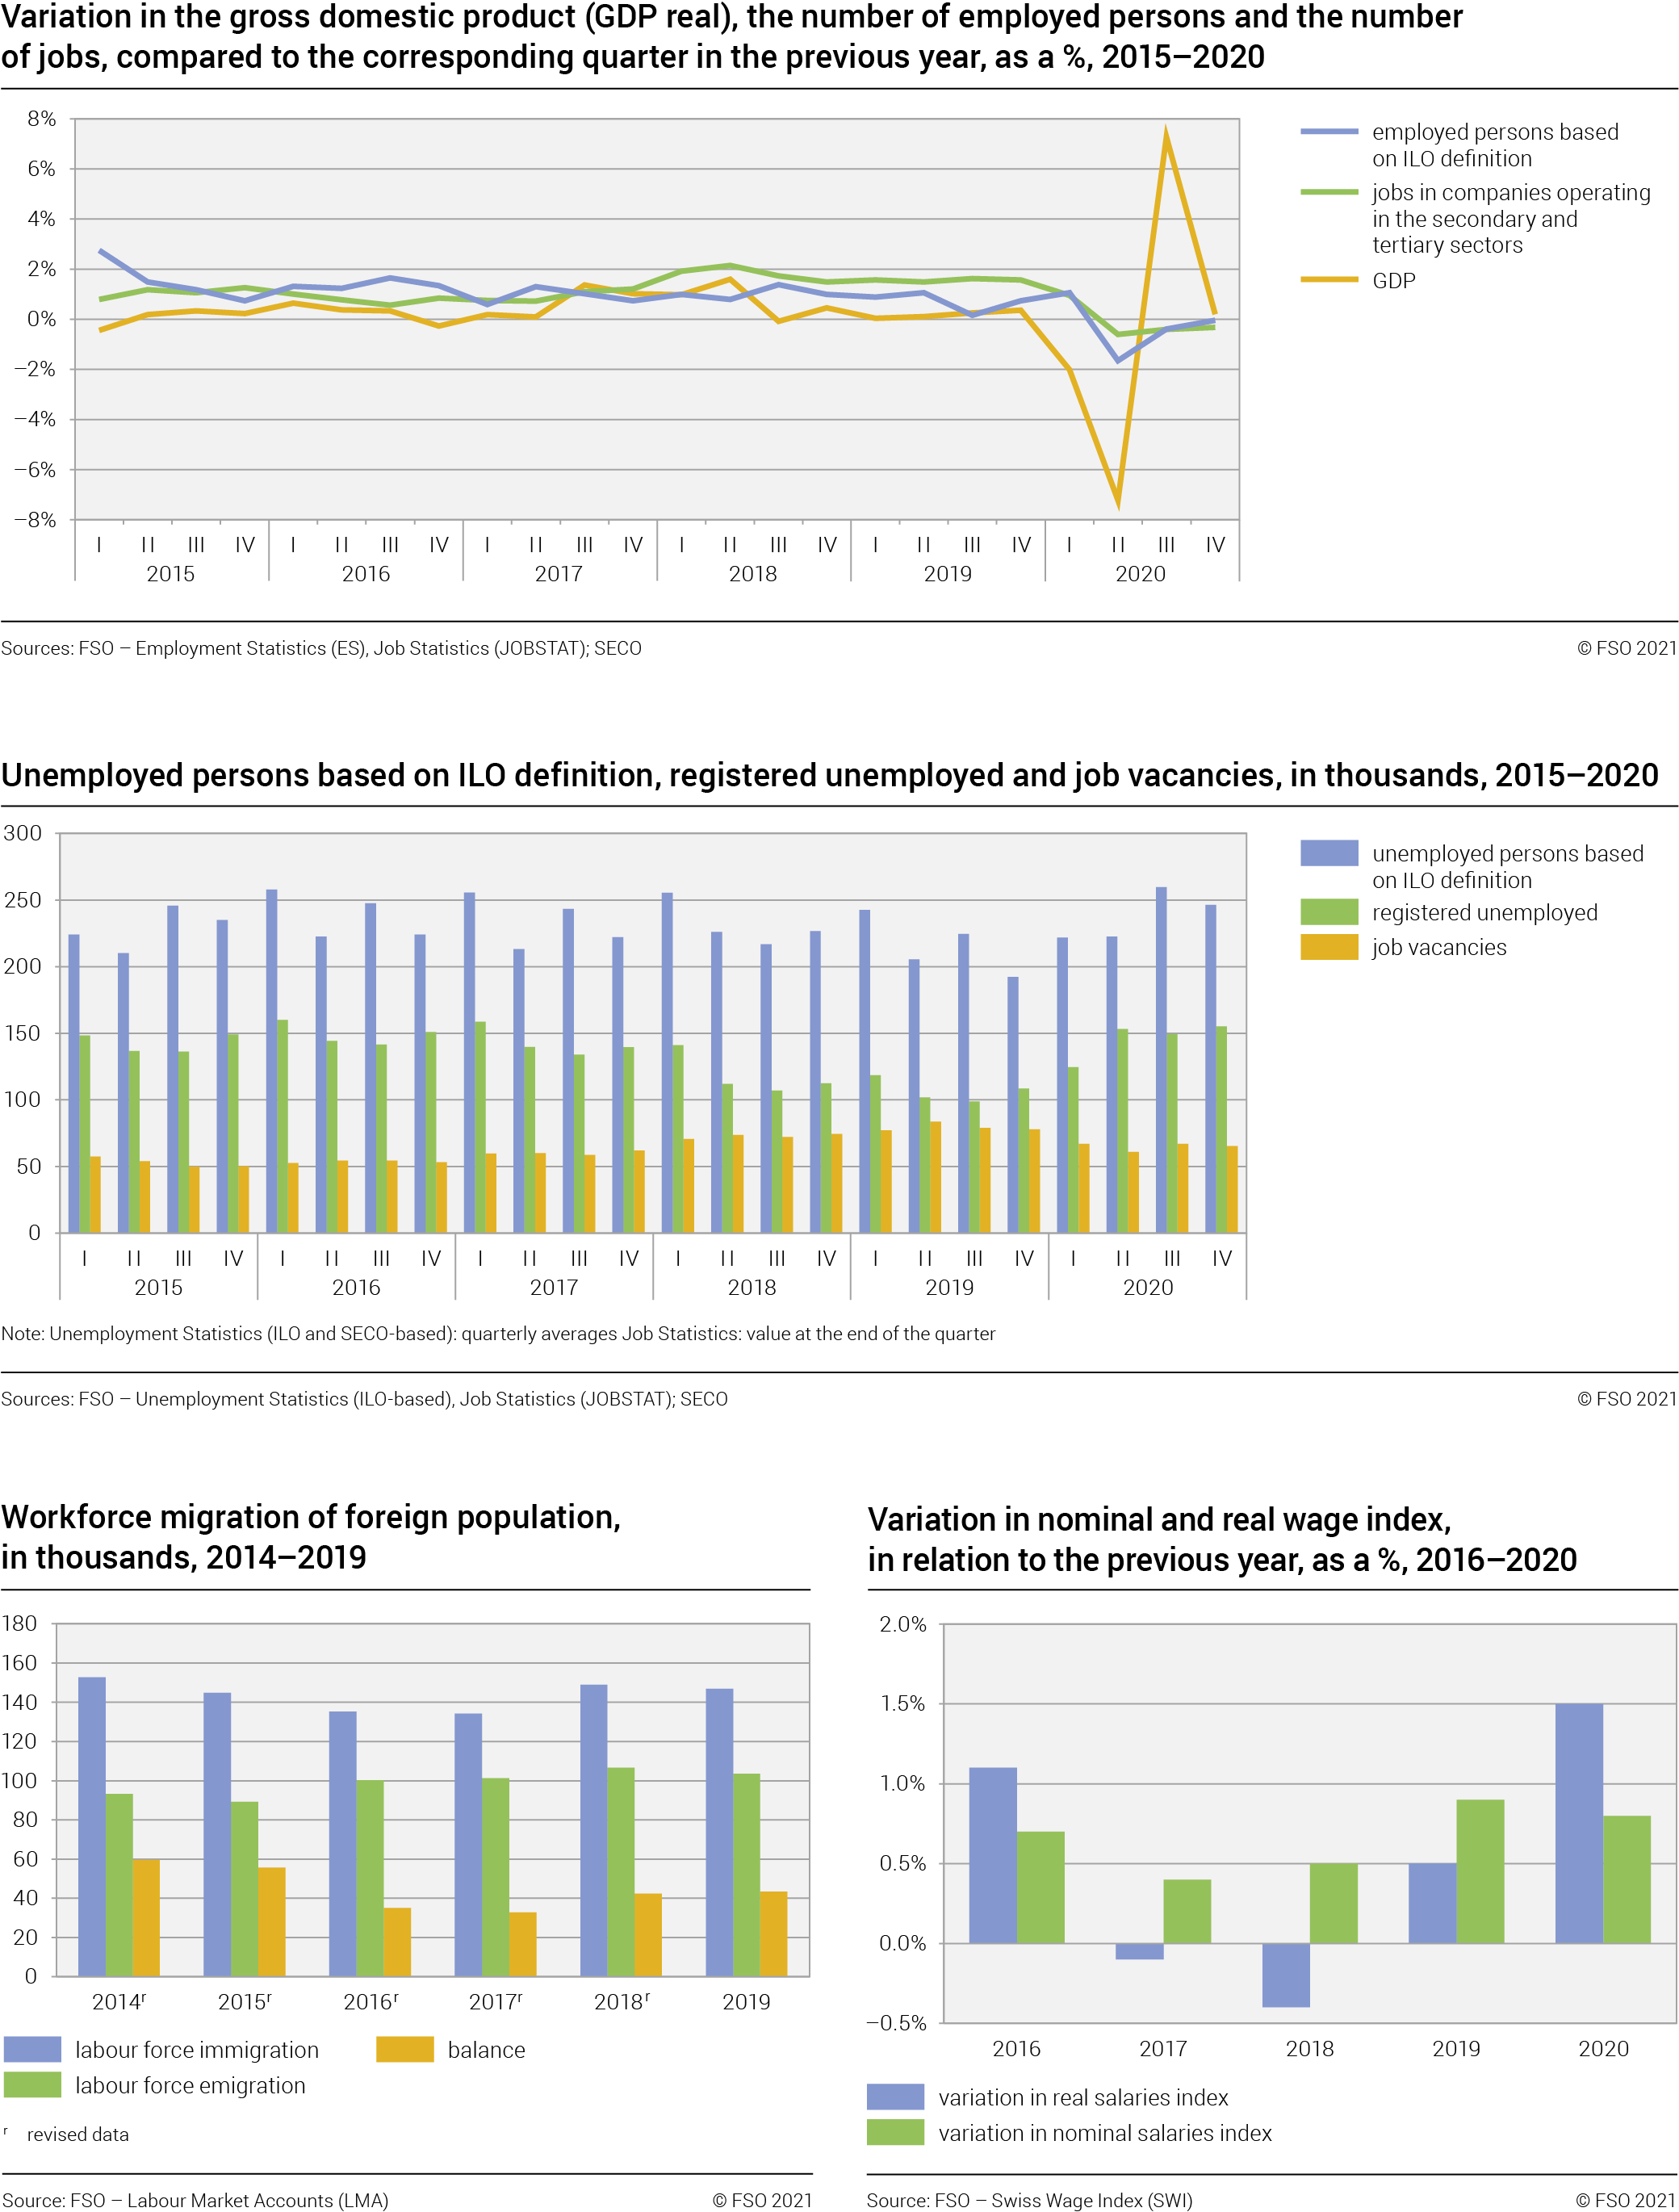
2015– 2020: Major developments in the Swiss labour market
The labour market in 2020 was marked by the Covid-19 pandemic. Between the 4th quarter 2019 and 4th quarter 2020, the number of unemployed persons rose, the number of people working short-time increased sharply, and there were fewer job vacancies. Nevertheless, over the five year-period (fourth quarter 2015 to fourth quarter 2020), the number of employed persons in Switzerland rose. However, because of the increase in 2020, the unemployment rate based on ILO definition and the registered unemployment rate (persons registered at regional placement offices, RAV, as unemployed) also rose in five-year comparison.
Pandemic led to decline in GDP
At the start of 2015, economic growth weakened in a difficult currency environment. Between the first quarter 2015 and the fourth quarter 2016, the Swiss economy grew an average of only 0.2% per quarter. From the first quarter 2017, the Swiss economy recovered and saw average growth of 0.9% per quarter until the second quarter 2018. In the second half-year, the Swiss economy slowed down and GDP grew by an average of 0.2% per quarter until the end of 2019. In 2020, the pandemic led to a historic slump in economic growth and GDP fell by 7.2% in the 2nd quarter. The economy recovered in the 3rd quarter (+7.3%), but in the 4th quarter recovery slackened again (+0.2%). The Corona pandemic led to the worst recession for decades and the decline in GDP was sharper than in the financial crisis of 2009.
Increase in employed persons curbed
According to the Employment Statistics (ES), which are based on personal interviews (Swiss Labour Force Survey SLFS), between the fourth quarters of 2015 and 2020, the number of employed persons rose by 3.8% to 5.1 million. The Job Statistics (JOBSTAT), which are based on a survey of secondary and tertiary sector enterprises, showed a 4.9% rise in the number of jobs (to 5.1m). The increase can, however, mainly be attributed to growth until the end of 2019. From the 2nd quarter 2020, the number of both employed persons and that of jobs fell. But the labour market recovered again by the end of the year, resulting in stable numbers between the 4th quarter 2019 and 4th quarter 2020 (employed persons: –0.04%; jobs: –0.3%).
Rise in unemployment due to pandemic
In five-year comparison, the unemployment rate based on ILO definition remained stable at 4.9%, the registered unemployment rate at 3.3%. This was only because the rise caused by the pandemic cancelled out the decline seen until the end of 2019. In the 4th quarter 2019, 3.9% of the economically active population were unemployed and the registered unemployment rate was 2.3%. The Covid-19 crisis, however, led to a 28.1% increase in unemployed persons (+54 000 persons), the number of registered unemployed persons rising by as much as 43.2% (+47 000 persons).
Historic increase in short-time work
The number of persons working reduced hours rose because of the Covid-19 crisis. Whereas in February 2020 only around 5000 persons were working reduced hours, in March 2020 this figure had risen to 970 000. In April, this figure rose again to 1.3 million persons, representing around 26% of employed persons. By October the use of short-time work fell to 250 000 persons but rose again until December to 400 000 due to renewed governmental measures. Reduced working hours were last intensively used after the global financial and economic crisis. In May 2009, reduced working hours were registered for 92 200 employees, which was the highest monthly figure registered in 2009.
Fewer vacancies during pandemic
In 2020, the Covid-19 crisis led to a decline in the number of vacancies according to BESTA. In the 4th quarter 2020, the Swiss economy counted 12 600 fewer vacancies than in the 4th quarter 2019 of the previous year (–16.1%). The biggest decline was seen in the 2nd quarter (–26.9%) in comparison to the same quarter of the previous year. Due to a large increase between the 4th quarter 2015 and the 4th quarter 2019 (+55.7%), there were however around 30% more vacancies in the 4th quarter 2020 than five years previously.
Nominal and real wage growth
In 2020, nominal wages rose by an average of +0.8% compared with the previous year (+0.9% in 2019 and +0.5% in 2018). This nominal increase confirms a trend of wage moderation that has been observed since 2010 with annual rates of no more than +1.0%. Decisions on pay rises in 2020 were generally made in September 2019. At that time, inflation was estimated at +0.4% for 2020 and eventually settled at –0.7% in connection with the health crisis. The purchasing power of wages rose in consequence by 1.5% (2019: 0.5%; 2018: –0.4%). Over the past five years, from 2016 to 2020, the average annual real wage increase for all employees was +0.5% (men: +0.5%, women: +0.6%). The more sustained increase in the women’s wage index continues a long-term trend. Women’s lower wages grew closer to those of men (–23.7% median wage gap in 1994 compared with –11.5% in 2018), but wage inequality continues today.
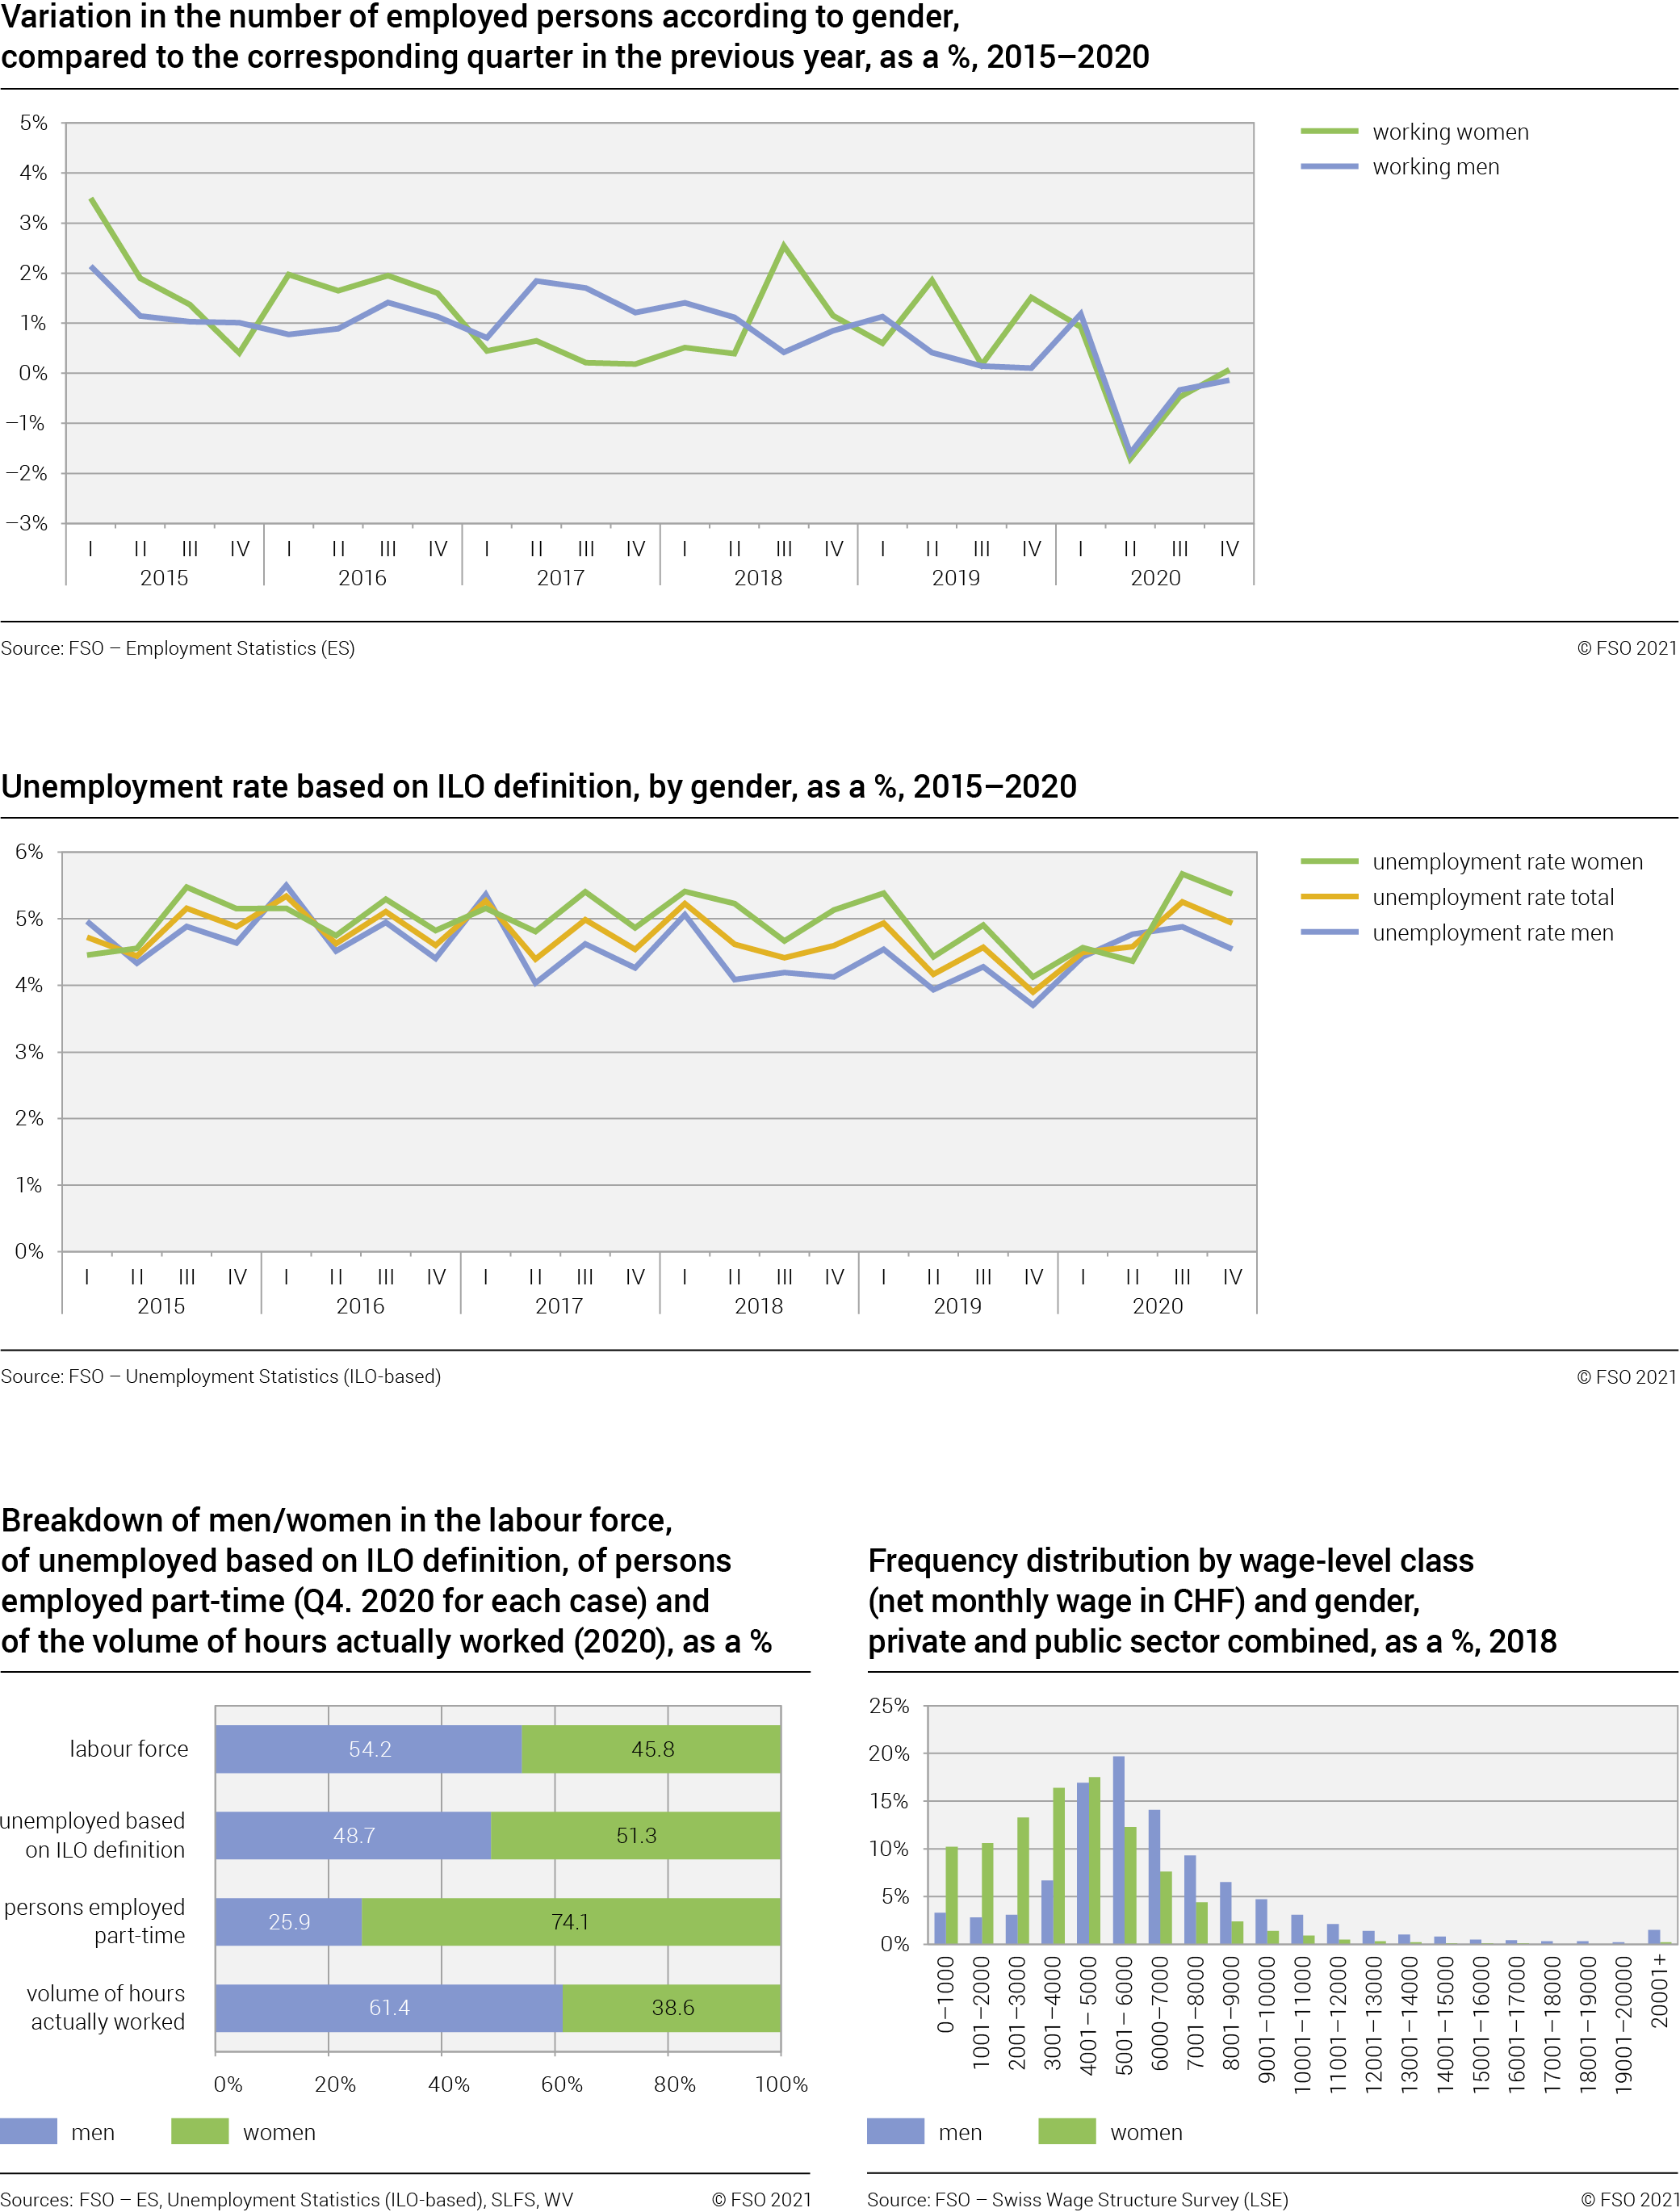
2015– 2020: The situation of men and women in the labour market
Between 2015 and 2020, the share of women participating in the labour market increased. More and more men and women work part-time. The share of women working part-time (59.2%) continued to be considerably greater than that of men (18.2%). The unemployment rates based on ILO definition of men and women fell until the end of 2019 but in 2020 they rose again sharply. This meant that in five-year comparison, they remained stable (men: 4.5%, women: 5.4%). When comparing wages in full-time equivalents, women earn on average 11.5% less than men. This gap is only partly explained by objective characteristics.
Part-time work increasing among men
Women are more likely to work part-time than men: In the fourth quarter 2020, 59.2% of all employed women worked part-time (i.e. work-time percentage of less than 90%), 0.2 percentage points less than in the 4th quarter 2015. Among men, the share has risen by 0.5 percentage points since the end of 2015 to 18.2%. The number of persons employed part-time increased both among women (+7.4%) and among men (+10.9%) between the fourth quarter 2015 and the fourth quarter 2020.
The unequal distribution of part-time work is also the reason why women accounted for only 38.6% of the total hours worked in 2020. Among the 459 000 men working part-time in the fourth quarter 2020, there were 101 000 underemployed persons (22.1%), i.e. persons who wish to work more and are available at short notice. Of the 1 317 000 women working part-time, 283 000 were underemployed, corresponding to 21.5%. In five-year comparison, the share of underemployed persons among the part-time employed increased among women (+1.8 percentage points) and fell among men (–1.2 percentage points).
Women more likely than men to be employed
in the services sector
Between the fourth quarter 2015 and the fourth quarter 2020, the trends of employed persons of both sexes were comparable in the different economic sectors. Whereas in the secondary sector, the number of employed men and women saw below-average growth (+ 0.2% and + 0.7% respectively), in the tertiary sector the number among both sexes saw an above average increase (men: +6.3%, women: +6.4%). Proportionally, women work considerably more frequently in the services sector than do men (fourth quarter 2020: 87.8% and 68.0% respectively). Only 10.5% of women are employed in industry and 1.7% in agriculture. The share of employed men working in industry is 29.1% and in agriculture 2.9%.
Share of women in economically active population
rose slightly
The number of economically active persons (employed and ILO unemployed persons together correspond to the labour supply) rose between the fourth quarter 2015 and the fourth quarter 2020 by 2.7% among men (to 2.6m) while the female economically active population rose by 4.8% during the same period (to 2.4m). Thus, the share of women in the economically active population increased slightly within five years by 0.5 percentage points to 47.1%. The number of employed women rose by 4.6%, i.e. markedly more than that of men (+2.8%).
Unemployment rate of women rose
Between the 4th quarter 2015 and the 4th quarter 2019, the female and male unemployment rate based on ILO definition fell (from 5.2% to 4.1% and from 4.6% to 3.7% respectively). Due to a sharper decrease among women, the two rates drew closer. In the pandemic year 2020, a particularly sharp rise in the unemployment rate of women was seen, from 4.1% in the 4th quarter 2019 to 5.4% in the 4th quarter 2020. There was also an increase in male unemployment in the same period, from 3.7% to 4.5%. Due to developments in 2020, in five-year comparison the gap between male and female unemployment rates widened. In comparison with the end of 2015, (men: 4.6%, women: 5.1%) the male unemployment rate based on the ILO definition fell (–0.1 percentage point), while that of women’s rose slightly (+0.2 percentage points). This resulted in a gap that was 0.3 percentage points larger in 2020 (men: 4.5%, women: 5.4%).
Due to the sharp increase in 2020, in five-year comparison the number of unemployed women according to the ILO definition also rose markedly more (9.2%) than that of men (0.6%). This led to an increase in the share of women among the unemployed from 49.2% in 2015 to 51.3% in 2020 (fourth quarter for each year).
Wage inequality between women and men gradually decreasing
In 2018 the monthly gross median wage of women in the overall economy was CHF 6067 and that of men CHF 6857. The wage gap fell from 12.5% in 2014 to 12.5% in 2016 and to 11.5% in 2018. In the private sector, women earned 14.4% less than men in 2018, and 11.4% less in the public sector.
According to an analysis commissioned by the Federal Statistical Office, 57.1% of the wage gap (arithmetic mean) in 2016 in the whole economy could be explained by various objective structures such as place in the hierarchy, number of years service or education. 42.9% of the pay gap remains unexplained.
2015–2020: Swiss and foreign labour force
Since 2001, Switzerland has experienced a high level of foreign worker immigration. Between 2015 and 2020, the increase in the number of foreigners in the labour force was four times higher than the increase in the number of Swiss workers. Without naturalisations, the difference would have been markedly greater. Over the entire period under review, the unemployment rate based on the ILO definition was two to three times higher among foreign nationals than among Swiss nationals. Swiss workers generally earn more than their foreign counterparts, except in jobs with a high level of responsibility.
Continued high level of immigration of foreign labour
Between the fourth quarter of 2015 and the fourth quarter of 2020, the number of economically active foreign nationals (employed foreign nationals and foreign nationals who were unemployed based on the ILO definition) grew four times faster than the number of economically active Swiss nationals (+8.0% to 1.8m compared with +2.0% to 3.6m). Compared with the same quarter of the previous year, the number of Swiss persons in employment actually fell in the first half of 2020 (2nd quarter 2020: –2.0%), between the end of 2019 and the end of 2020, however, both the foreign and Swiss economically active population grew. The strong rise in the number of foreign workers is the result of heavy immigration: During the period 2015 to 2019, immigration of foreign workers exceeded the number of emigrations by 209 000 persons. However, the annual net migration of economically active foreign nationals between 2015 and 2019 fell (from 60 000 to 43 000 persons). In contrast, the migration of economically active Swiss citizens resulted in a negative balance of 23 000 persons over the five-year period. Naturalisations play a role in the structure of the economically active population: from 2015 to 2019, approximately 131 000 economically active foreigners obtained Swiss nationality. Were it not for these naturalisations, the number of foreign workers would have increased by 16.0% from 2015 to 2019, whereas the number of economically active Swiss citizens would have fallen (–1.7%). During the fourth quarter 2020, the share of foreign nationals in the economically active population was 32.8%, compared with 31.5% five years earlier.
Foreign nationals more often affected by unemployment
In the fourth quarter of 2020, 3.5m economically active Swiss nationals were employed in the labour market and 138 000 were unemployed based on the ILO definition. Thus, the unemployment rate based on the ILO definition of the Swiss population was 3.8%. Whereas the rate for Swiss nationals during the period under observation fluctuated between 3.0% (2019) and 4.0% (3rd quarter 2020), the situation was less favourable for foreigners: 1.6 million foreign nationals were employed in Q4 2020 and 108 000 were unemployed. The unemployment rate of the foreign population was 7.9%. But in comparison with the fourth quarter 2015 (9.1%) it declined.
Less part-time work among foreign nationals
Between the fourth quarter 2015 and the fourth quarter 2020, the number of people working part-time rose among both Swiss and foreign workers (+2.4 percentage points to 41.5% and +0.2 percentage points to 26.1% respectively). This type of work is common among women, albeit more common among Swiss women than foreign women: in the 4th quarter 2020, 63.3% of Swiss women were employed on a part-time basis, compared with 46.4% of foreign women. Among men, the corresponding shares were 21.1% and 11.0%. Foreign workers are mainly salaried employees (95.3%; Swiss nationals: 89.4%). Only 4.7% are self-employed or work in a family-run enterprise or farm, considerably less than Swiss workers (10.6%). This difference is attributable to several factors: these include the impossibility for foreign persons of the first generation to take over a family-owned business. Moreover, the share of persons under age 40 is larger in the foreign population than in the Swiss population (the 40-64-year-old age group has a much higher proportion of self-employed persons than among those aged under 40).
Increasing share of foreign workers with a settlement permit
The structure of the employed foreign population by permit status has changed only slightly in the past five years. While the shares of cross-border commuters holding a G permit and permanent residence permit holders (C permit) rose slightly (0.7 percentage points to 20.7% and 0.3 percentage points to 47.5% respectively), workers with a residence permit (B permit) fell by 0.4 percentage points to 27.6% and the share of short-term permit holders (L permit) fell by 1.1 percentage points to 2.1%.
Foreign workers: Differences depending on residence status
In the economy as a whole, the wages of Swiss workers were higher in 2018 than those of foreign workers (CHF 6873 compared with CHF 5886). This wage gap in favour of Swiss workers compared with foreign workers was observed across all categories of residence.
However, when looking at jobs with a high level of responsibility, foreign workers had higher wages than their Swiss counterparts. Among senior managers, cross-border commuters earned CHF 10 750, those with resident permits CHF 12 510 and Swiss nationals CHF 10 138.
The opposite held true for jobs without managerial responsibility: At CHF 6260 the wages of Swiss workers were higher than those of foreign workers with cross-border commuter status (CHF 5699) and those with a residence permit (CHF 5189).

2015–2020: Working conditions in Switzerland
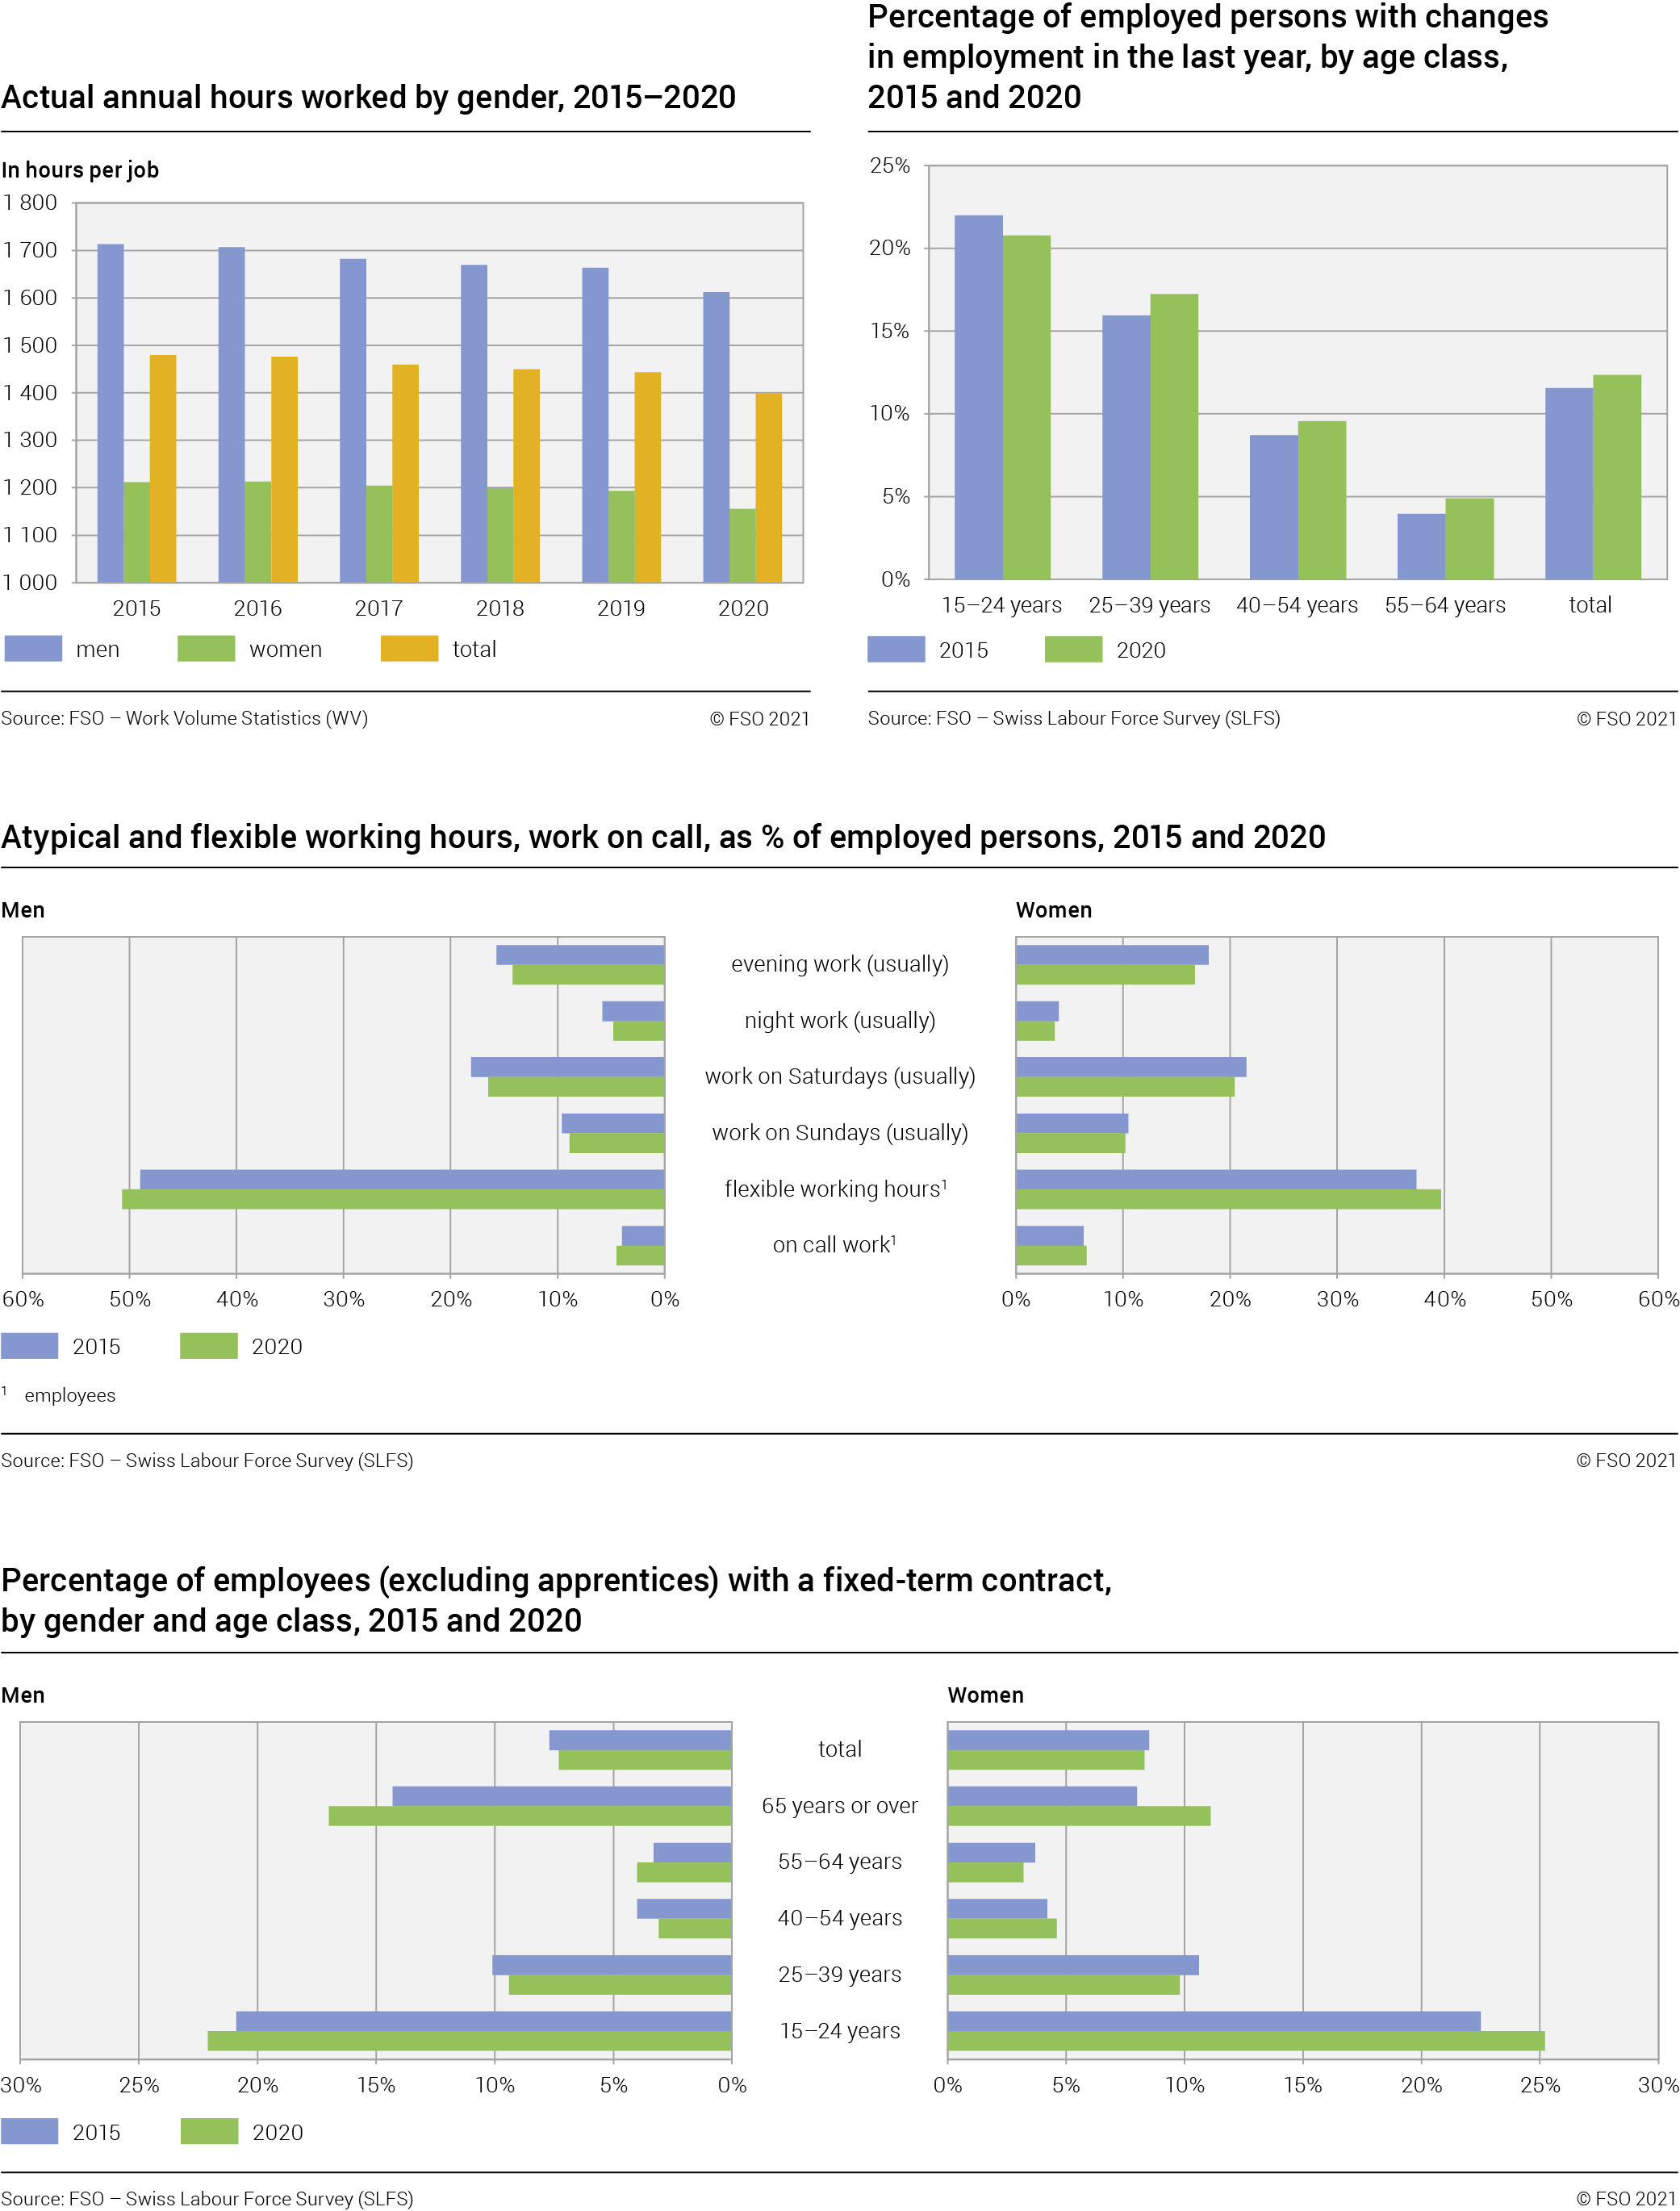
Working conditions in Switzerland changed between 2015 and 2020: there was a drop in the actual hours worked. The same period saw an increase in flexible working hours and multiple employment rose while there was a slight decline in fixed-term contracts and work on Saturdays.
Actual annual hours worked decrease
Between 2015 and 2020, the actual annual hours worked per job continued to fall, settling at 1399 hours per job, i.e. a decline of 5.5% over five years. The decrease was more marked between 2019 and 2020 due to the Covid-19 pandemic (–3.1%).
Over five years, the actual annual hours worked fell more sharply among men (–5.9%) than among women (–4.6%). The decline was higher among self-employed persons (–8.1%) than among employees (–6.0%).
Taking into account only full-time employees, actually weekly hours fell slightly between 2015 and 2019 (–11 minutes to settle at 40 hours and 54 minutes), then fell more sharply between 2019 and 2020, reaching 37 hours and 44 minutes.
Flexible working hours on the rise
In 2020, 45.4% of employees had flexible working hours (2015: 43.1%).
Men were more likely to have flexible working hours than women (50.7% compared with 39.7%). However, since 2015, the percentage of women with flexible working hours (+2.3 percentage points) has seen a greater increase than among men (+1.7 percentage points).
Young employees and those aged over 64 more likely
to work on-call
In 2020, 15.4% of employed persons regularly worked in the evening (between 19:00 and midnight; 2015: 16.8%). 4.2% worked regularly at night (between midnight and 6:00; 2015: 5.0%). Women are more likely to work in the evening (16.7%) than men (14.2%), whereas men are more likely to work at night (4.8%) than women (3.6%).
In 2020, 18.2% of employed persons worked regularly on Saturdays, representing a fall of 1.6 percentage points compared with 2015. Women were more likely to work on Saturdays (20.7%) than men (16.1%). However, major differences could be seen between the different age groups: employed men aged over 65 (27.3%) as well as women between 15 and 24 years (29.0%) were most likely to work on Saturdays.
In 2020, 9.3% of employed persons worked on Sundays (2015: 9.9%).
5.5% of employees worked on-call in 2020. This percentage has risen slightly from 2015 (5.1%). Women (6.6%) were more likely to work on-call than men (4.5%). By age group, employees aged 65 and over were the most likely to find themselves in this type of work (25.0%), followed by 15–24 year-olds (9.8%).
Young employees more often have a fixed-term contract
In 2020, 7.8% of employees worked on a fixed-term contract compared with 8.1% in 2015. The percentage of women (8.3%) was slightly higher than that of men (7.3%). However, this type of contract is most common among employees aged 15 to 24. In this age group, almost a quarter (23.8%) (excluding apprentices) have a fixed-term contract.
Rise in multiple employment
In 2020, 7.8% of employed persons had more than one job. In the past five years, the percentage of people in multiple employment rose by 0.4 percentage points.
Women are more likely than men to have several jobs. In 2020, the percentage of women (10.3%) holding more than one job was almost twice that of men (5.6%).
Young employed persons change jobs more often
Professional mobility rose slightly in Switzerland between 2015 and 2020. Overall, 12.3% of employed persons changed job in 2020 (2015: 11.5%); 3.3% of them within the same company and the remaining 9.1% to another company.
There is little difference in the percentage of women and men changing jobs (12.3% and 12.2% respectively). With increasing age, however, professional mobility declines considerably: while approximately a fifth of 15 to 24 year-olds and 25 to 39 year-olds changed job in 2020 (20.8% and 17.2%), only 4.9% of 55 to 64 year-olds did so. However, among 15 to 24 year-olds, job changes fell in comparison with 2015 by –1.2 percentage points (2015: 22.0%; 2020: 20.8%). In all other age groups, job changes increased.
Increase in teleworking from home in 2020
In 2020, the percentage of persons teleworking from home rose sharply as a part of the measures to fight the Covid-19 pandemic. In 2019 at least a quarter of employed persons undertook teleworking from home occasionally (24.6%). In 2020, the average annual value was 34.1%, with record values seen for the second and fourth quarters (39.7% and 37.3% respectively).
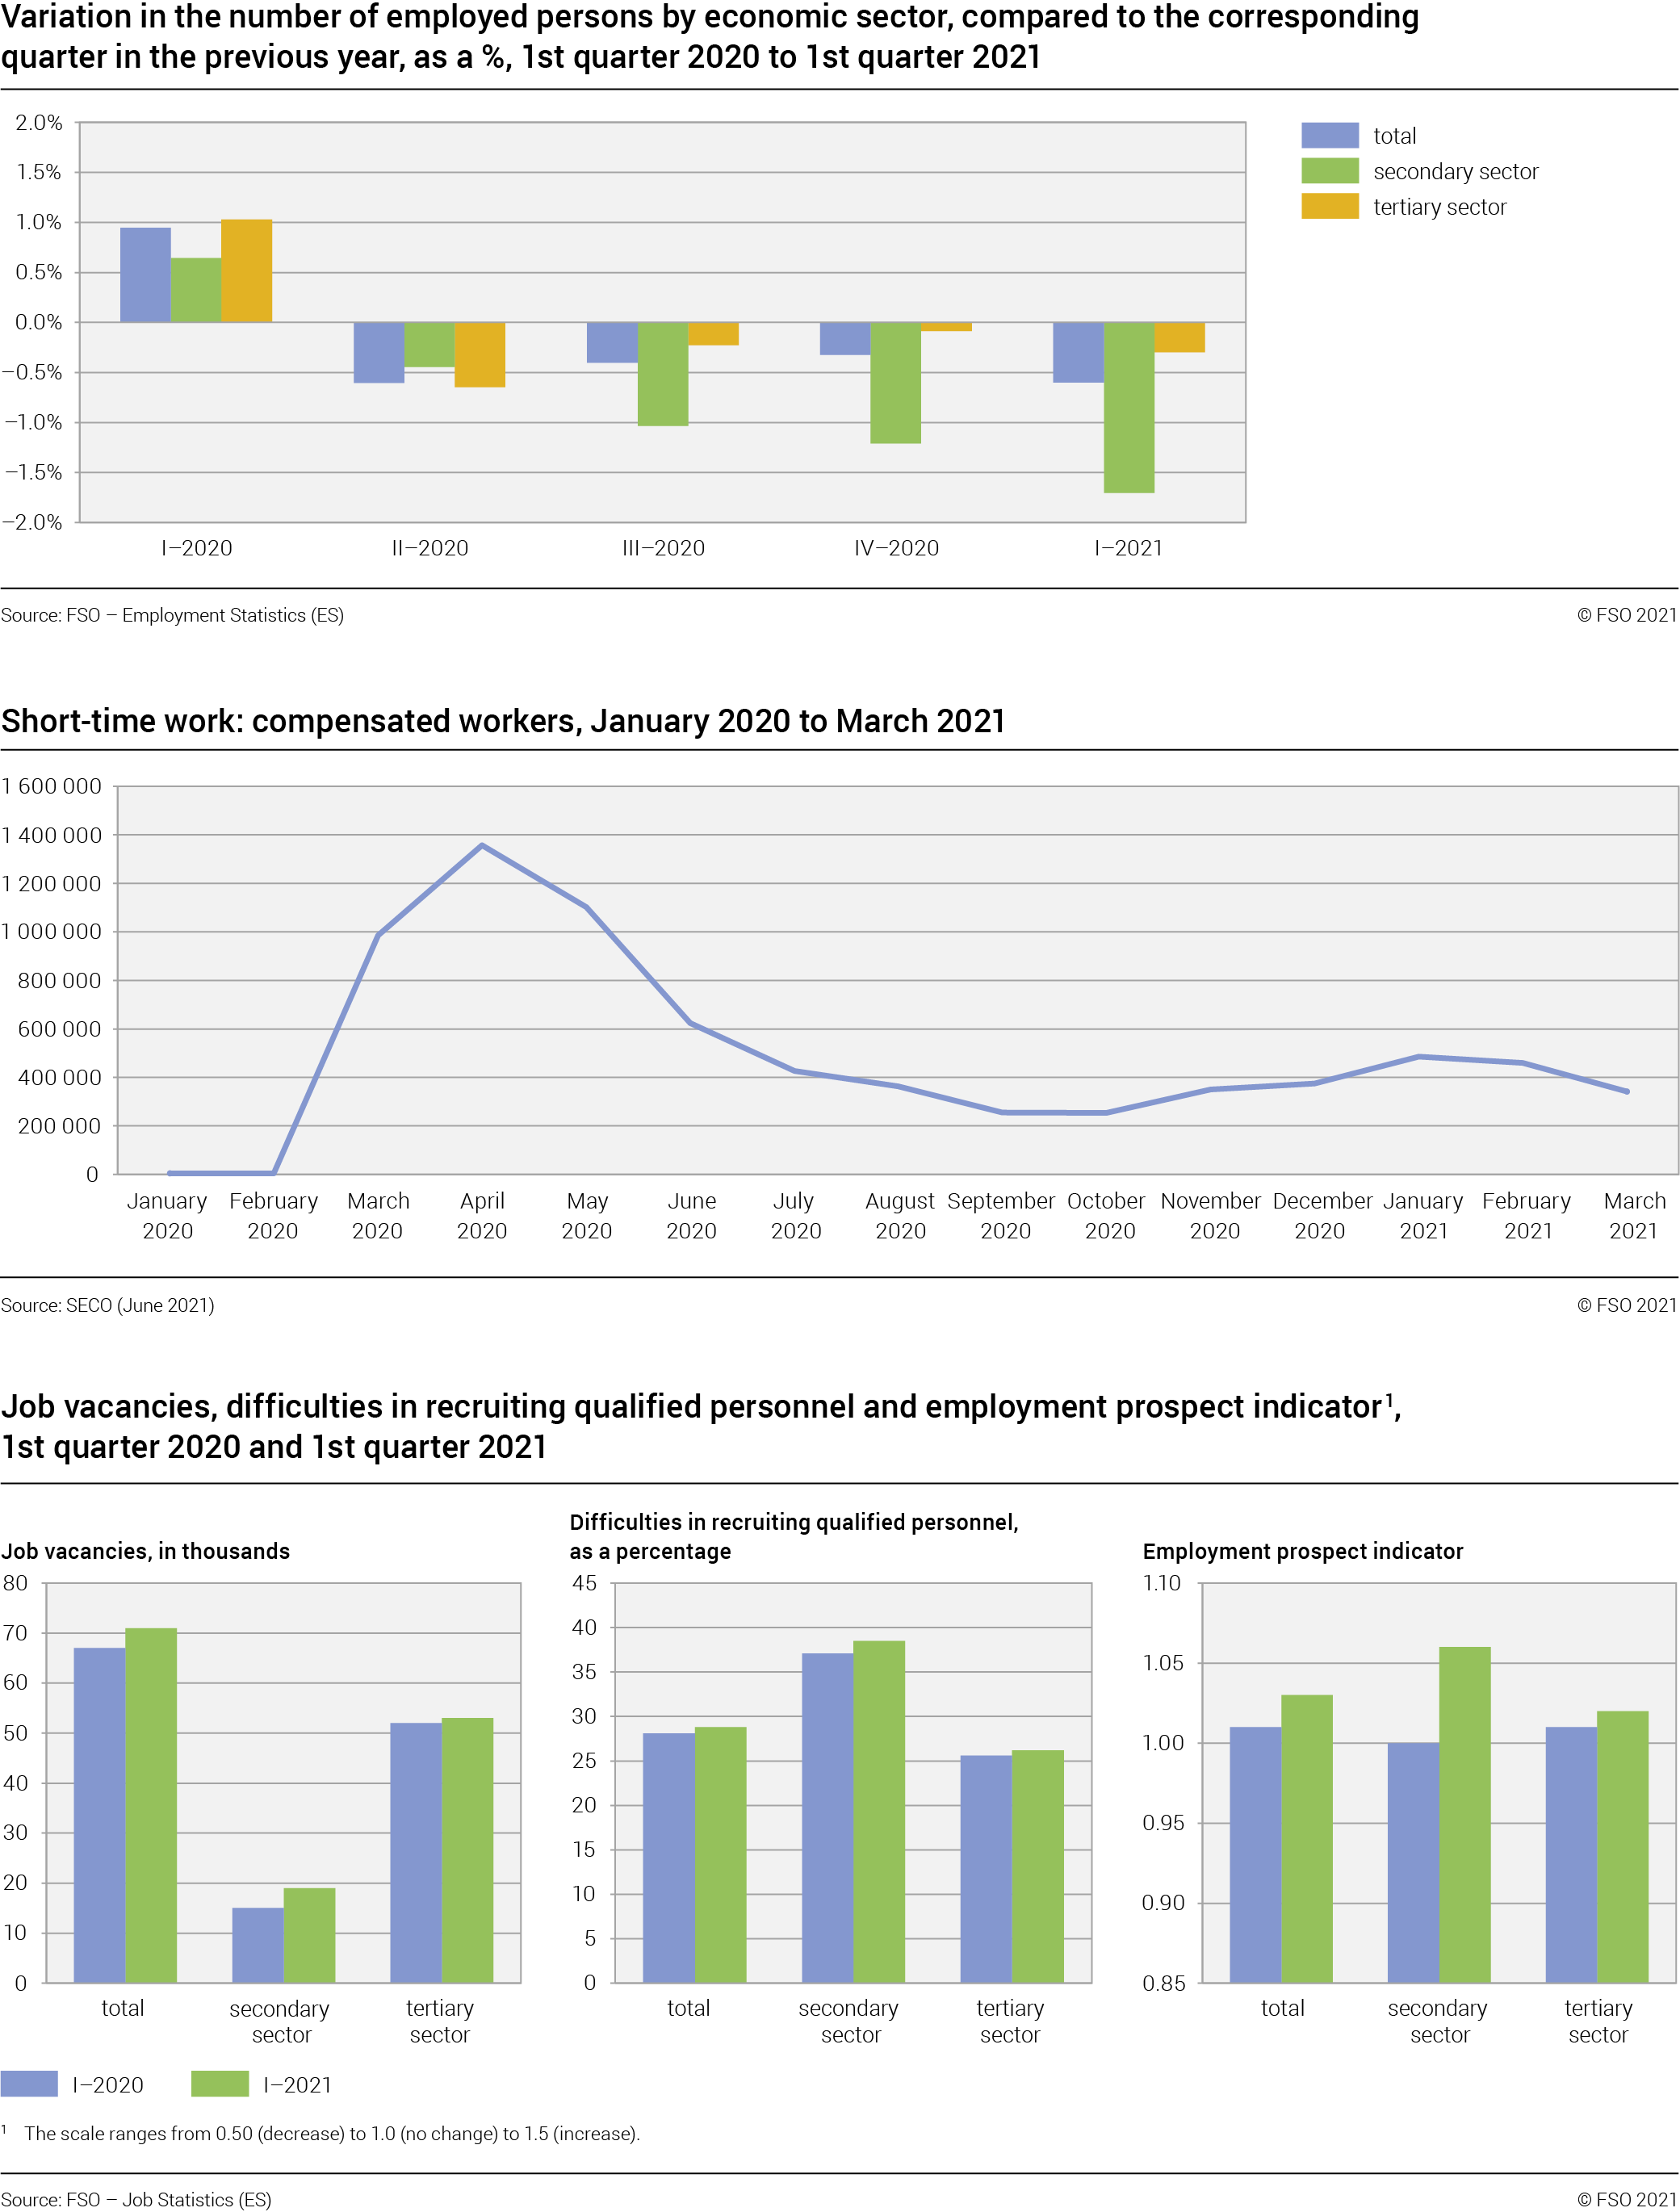
Labour market in the first quarter of 2021 and short-term prospects
In the first quarter 2021, the labour market in Switzerland continued to feel the effects of the COVID-19 pandemic. In comparison to the same quarter of the previous year, the number of jobs thus declined and the registered unemployment rate as defined by SECO continued to rise. The number of persons affected by a reduction of working hours also rose over the winter due to Covid measures. The employment outlook is, however, optimistic. In comparison with the same quarter of the previous year, there were 4000 more vacancies in the entire economy in the 1st quarter 2021 (+6.0%) and the employment outlook indicator has risen (+2.6%).
Decline in the number of jobs
In the first quarter 2021, the number of jobs decreased by 31 000 compared with the same quarter a year earlier, representing a decline of –0.6%. Growth by economic sector was heavily impacted by the COVID-19 pandemic and the measures taken. The greatest decline was seen in the restaurant and hotel industry (–13.9%) and in shipping and aviation (–11.2%). The number of jobs increased in some sectors including health and social work (+2.9%) and in computer programming, consultancy and related activities (+2.2%).
Increase in registered unemployment rate
In the first quarter 2021, 165 000 persons were registered at a regional placement office as unemployed, roughly 40 000 more than one year previously (1st quarter 2019: 125 000 persons). As a result, the registered unemployment rate according to SECO also rose from 2.7% in the 1st quarter 2020 to 3.6% in the 1st quarter 2021, an increase of 0.9 percentage points.
Continued wide-scale reduction of working hours
The introduction of new measures over the winter led to a further increase in the number of persons in short-time work in January 2021 to 486 000, accounting for 9% of all jobs. In December 2020 this number was 374 000. The number of short-time compensation claims remained high in the 1st quarter and according to provisional figures should gradually decrease from March 2021 along with the progressive easing of measures. In the 1st quarter 2021, however, considerably fewer persons were affected by a reduction of working hours than during the peak in the previous year in April 2020 (1.4 million persons, 26% of jobs).
Hotel and restaurant industry still seriously affected by reduction of working hours
Not all sectors were affected to the same extent by the official measures and hence by a reduction of working hours. The greatest numbers of people working reduced hours was seen in March 2021 in the following sectors: food service activities (76 000 persons), accommodation (29 000 persons), wholesale (19 000) and retail (18 000) trade.
If we consider the percentage of jobs per sector affected by a reduction of working hours, in March 2021, food service activities (42%) and accommodation (39%) were affected much more than wholesale (9%) and retail (6%) trade. Sectors affected even more than food service activities were shipping and aviation with 60% and gambling and betting activities with 54% of employees working reduced hours.
Increase in job vacancies
After the decline in vacancies in 2020, in the first quarter 2021 there were 71 000 vacancies in the economy as a whole. This was 4000 more than in the same quarter a year earlier (+6.0%). An increase in vacancies was seen in particular in the secondary sector (+22.5%), but also in the tertiary sector (+1.2%). The percentage of businesses experiencing difficulties in the recruitment of qualified personnel grew slightly compared with the same quarter a year earlier (+0.7 percentage points to 28.8%).
Optimistic employment outlook
The employment outlook indicator, which represents businesses’ expectations with regard to employment trends for the next three months, rose in comparison with the previous year (+2.6%). The increase was observed especially in the secondary sector (+5.9%), but the indicator also rose in the tertiary sector (+1.7%). A decline in the employment outlook was seen only in the transportation and storage sector (–8.2%), leading the indicator to fall below 1.00, indicating a decline in jobs in the next quarter. The outlook in accommodation and food service activities (+6.9%) is more positive than in the same quarter a year earlier, but the indicator is still below 1.00.
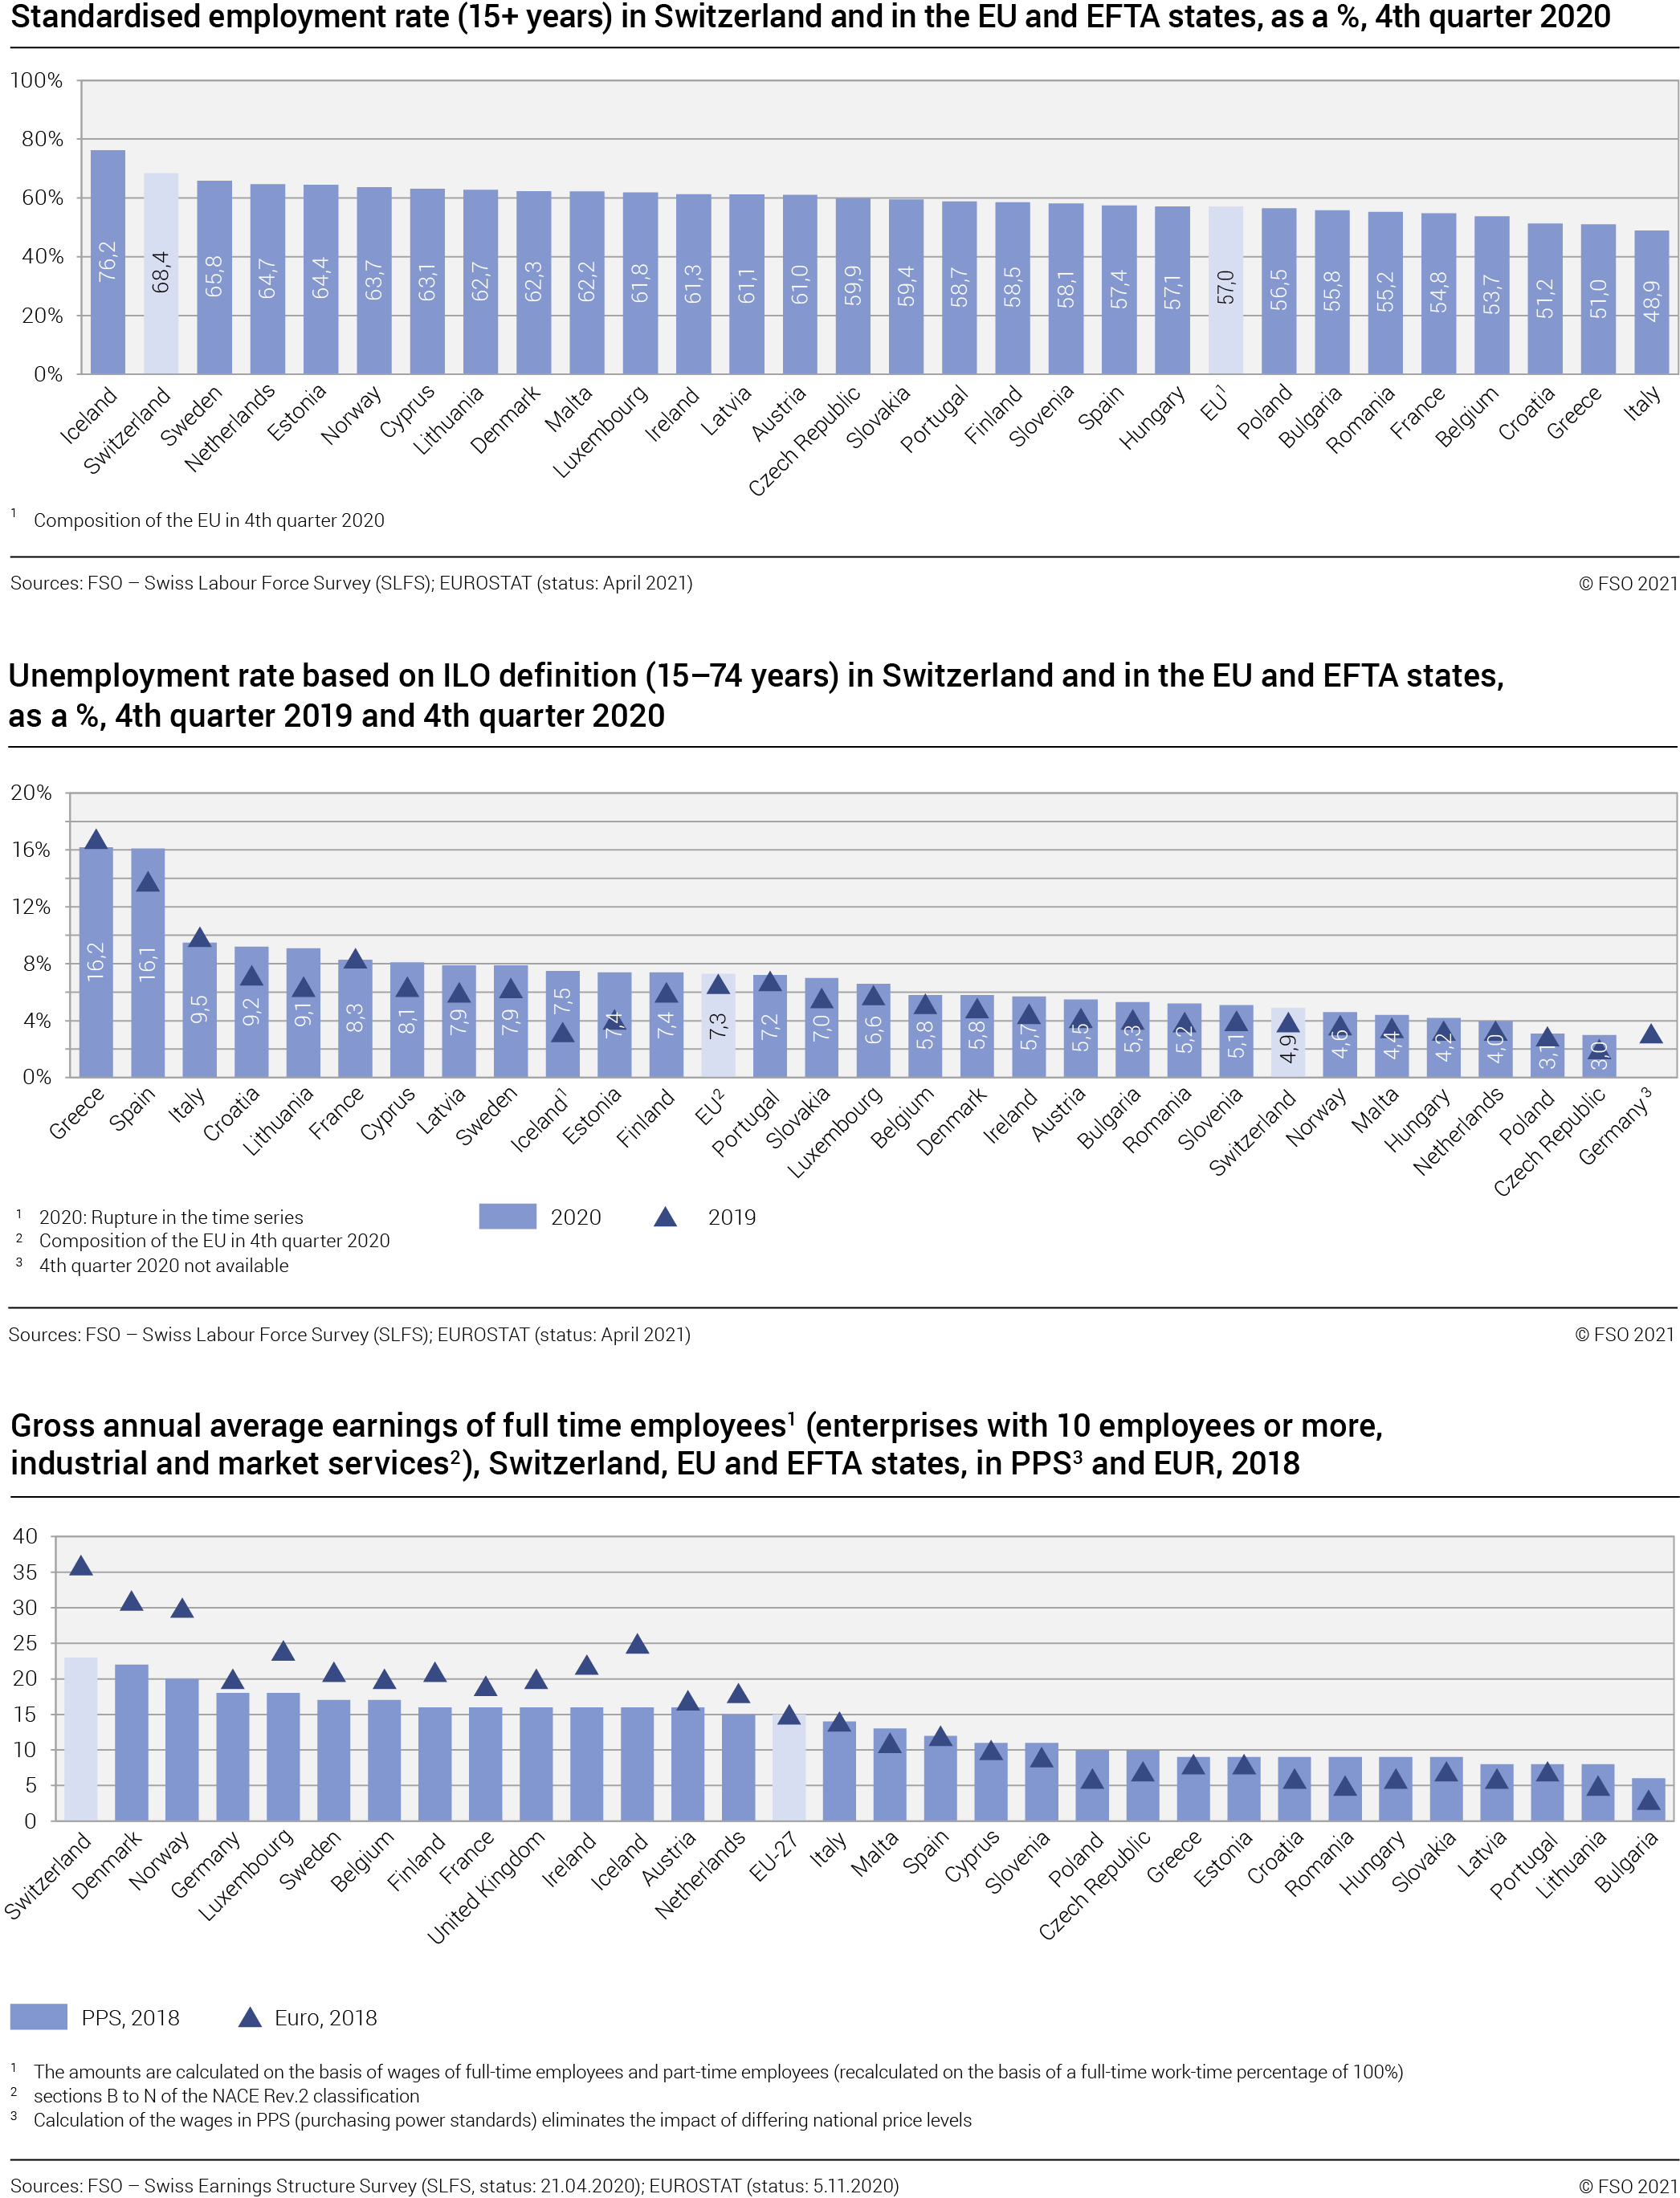
The Swiss labour market in international comparison
Despite the pandemic in 2020, the Swiss labour market performed well in international comparison. Both the economic activity rate and women’s participation in the labour market are among the highest in Europe. The latter is related among other things, to widespread part-time employment: the proportion of employed persons working part-time is markedly higher in Switzerland than in most European countries. Wages in Switzerland converted into Euros are higher than in other European countries. If the wages are converted into purchasing power standards to take into consideration the different price level index, the differences are less substantial, however.
Greater economic activity rate in Switzerland
In the fourth quarter of 2020, the economic activity rate of the Swiss population aged 15 or over was 68.4%. In European comparison, this places Switzerland in a leading position. The percentage of economically active persons was only higher in Iceland (76.2%), whereas Switzerland’s neighbouring countries showed a much lower economic activity rate (Germany: 62.6% Germany figures from 4th quarter 2019, as data missing for 2020 ; Austria: 61.5%; France: 59.8%; Italy: 48.9% Italy recorded the lowest economic activity rate in Europe, followed by Greece (51.0%) and Croatia (51.2%). The EU28 average was 57.0%.
Strong participation by women in the labour force
in Switzerland and in the Nordic countries
Women’s labour force participation rates differ greatly from one country to another. In Italy (40.2%), two in five women participated in the workforce, whereas the economic activity rates of women in Scandinavian countries were among the highest at 60% or more (Iceland: 72.8%; Sweden: 61.9%; Norway: 61.8%; the Netherlands: 60.2%). In Europe as a whole, one in two women is economically active (51.05). At individual country level, at 63.0% Switzerland occupies second place. In the neighbouring countries, women’s labour force participation is considerably lower (Germany: 57.2% 1 ; Austria: 55.9%; France: 51.1%). Women’s labour force participation in Switzerland is undoubtedly related to the wide availability of part-time jobs. 39.9% of employed persons in Switzerland worked part-time (women: 62.4%). Only in the Netherlands was this percentage higher (52.0%; women: 76.0%). The percentage of employed persons working part-time was particularly low in Bulgaria (1.8%; women: 2.3%) and in Slovakia (4.7%; women: 7.1%) Hungary (5.2%; women: 7.6%) and Croatia (5.5%; women: 7.1%).
In all of the countries examined, the male labour force participation rate was higher than that of women. The highest male economic activity rate was found in Iceland (79.3%), followed by Switzerland (73.5%). It is considerably lower in Switzerland’s neighbouring countries (Austria): 66.4%; France: 58.9%; Italy: 58.1%), the EU average stood at 63.3%.
Low unemployment rate based on ILO definition in Switzerland
In Switzerland, the unemployment rate based on the ILO definition rose by 1.0 percentage point between the fourth quarter of 2019 and the fourth quarter of 2020 to 4.9%. The Covid-19 crisis also led to higher unemployment rates in the EU, with the EU average rising for the first time since 2013 (by 0.7 percentage point to 7.3%). Compared with the EU member states, Switzerland features among the countries with the lowest unemployment rates based on the ILO definition. In France (8.3%) and Italy (9.5%) the unemployment rate is considerably higher. Unemployment rates below 4% can be found in Czech Republic (3.0%; +1.0 percentage points compared with same quarter or previous year) and in Poland (3.1%; +0.2 percentage points). Greece and Spain have the highest unemployment rate based on ILO definition in Europe (16.2%, –0.6 percentage points; 16.1%, + 2.3 percentage points, respectively). The greatest increase in unemployment between the 4th quarter 2019 and the 4th quarter 2020 was seen in Iceland (+4.3 percentage points to 7.5%), followed by Estonia (+3.3 percentage points to 7.4%) and Lithuania (+2.7 percentage points to 9.1%).
Wages in international comparison
The comparison of average gross hourly wages for employees working in industry and market services highlights the wage gap between the different EU countries. Distinct differences can be noted not only between the EU15 countries and member states that have joined the EU since 2004, but also within the two groups of countries.
In the EU15 states a north-south divide can still be observed: in 2018 the highest average gross hourly wages were recorded in Denmark (EUR 30.6), the lowest in Portugal (EUR 7.0). The wage gap is even greater when the new member states are also included: in 2018 only Malta, Cyprus, Slovenia and Poland showed wages higher than EUR 10 per hour, whereas Bulgaria, a country that became an EU member in 2007, comes last with gross hourly wages of EUR 3.3.
With a gross hourly wage of EUR 35.5, partly influenced by the strong franc, Switzerland occupies first place in front of Denmark.
In order to depict the actual purchasing power of wages, they must be converted from their national currency to a collective, fictional currency, the purchasing power standard (PPS). If the different price levels of each country are taken into account, the extent of the wage divide between countries is altered. Expressed in euros, the wages paid in Switzerland are more than ten and a half times higher than those paid in Bulgaria (+963%), whereas the difference is almost four times smaller (+255%) when converted into PPS. Looking at Switzerland’s neighbouring countries, expressed in euros, the hourly wages paid in Switzerland are 81% higher than those paid in Germany, +91% higher than in France, 104% higher than in Austria and 147% higher than in Italy. This difference is reduced when the comparison of average gross wages is made in PPS. The gaps are then only +24% compared with Germany, +39% with France, +47% with Austria and +64% with Italy.