Switzerland is becoming increasingly built-up. Between 1985 and 2018, settlement and urban areas increased by almost a third across the country. Residential areas grew by as much as 61% – twice as fast as the population. However, settlement growth has slowed slightly in the last three decades.
In 2018, settlement and urban areas occupied 3271 km2 in Switzerland as a whole. This represents 8% of the total national territory, roughly equal to an area the size of the canton of Vaud. Settlement and urban areas comprise not only buildings in the strict sense, but also all facilities and infrastructure related to housing, work, recreation and mobility – including diverse green areas such as gardens or public parks.
Housing and mobility take up the most space
The largest category within settlement and urban areas is the residential area, with a 35% share in 2018 (G9). In addition to residential buildings and garages, the residential area encompasses surrounding areas such as driveways, open spaces, lawns, and gardens, etc. The transportation area also took up much space, accounting for a 30% share comprised mainly of roads but also railway and airport areas. Industrial and commercial areas had a much smaller percentage share (8%), as did other building areas, which are comprised in particular of public and agricultural buildings; in 2018, they accounted for around 16% of settlement and urban areas. Recreational areas and cemeteries, which in addition to parks also include cemeteries, playgrounds and sports fields as well as allotments, accounted for a 6% share and special settlement areas for 5%. The extremely diverse category ‘special settlement areas’ includes infrastructure facilities such as power stations and waste water treatment plants, but also dumps and temporary installations such as construction sites or gravel pits.

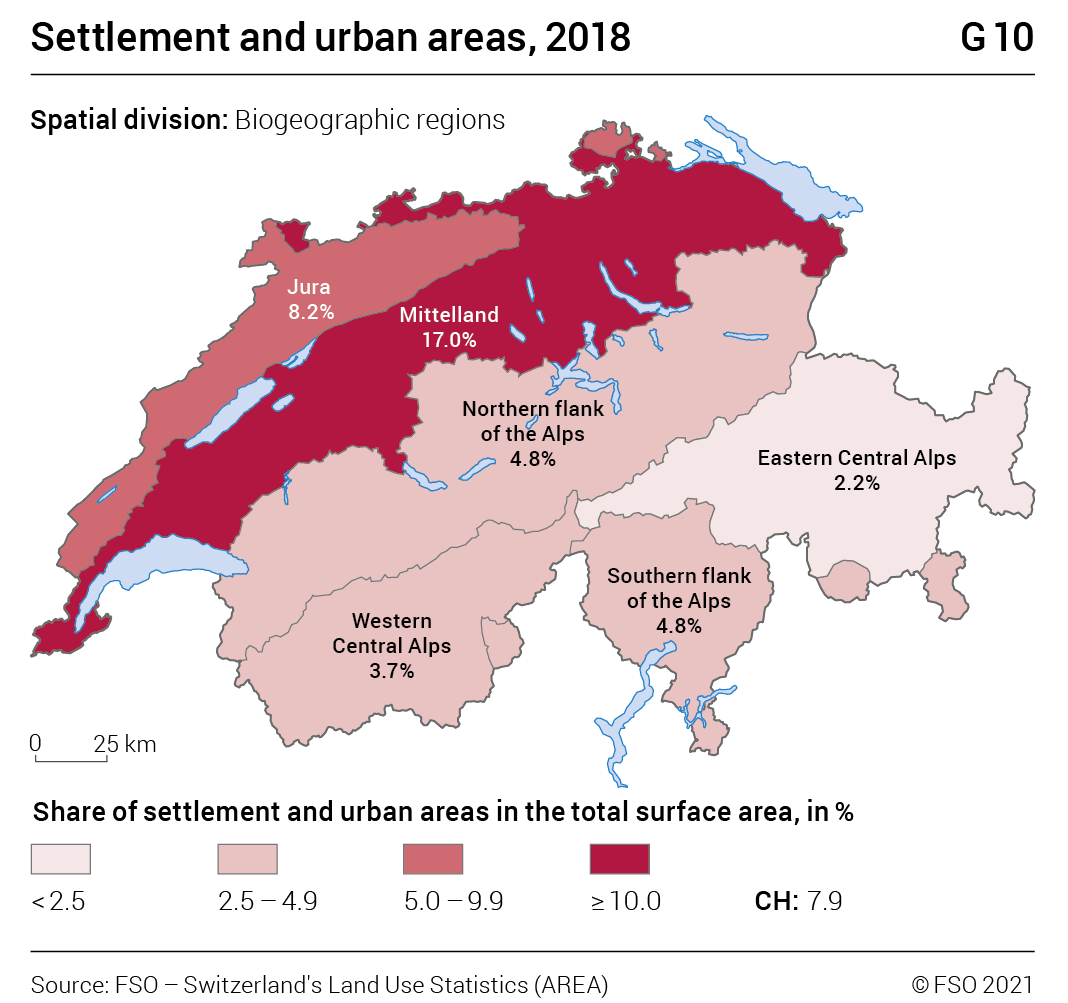
The proportion of settlement and urban areas in the total surface area greatly depends on the topography. The relatively flat Mittelland is by far the most densely populated region; in international comparison it is also considered a highly populated region. Here, settlement and urban areas covered some 17% of the entire surface area in 2018, whereas the corresponding share in the Jurassic Arc was only about half (8%), and in parts of the Alps hardly rose above 2% (G10).
Almost a third larger in three decades
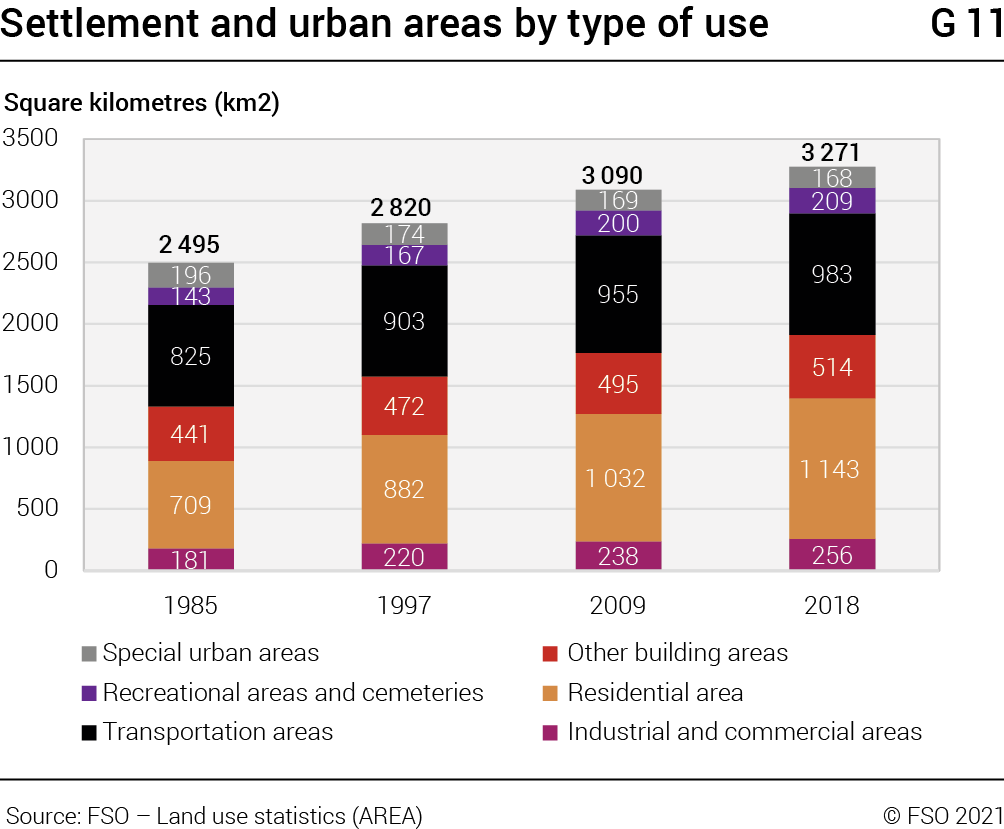
Between 1985 and 2018, settlement and urban areas in Switzerland increased by 776 km2 or 31% (G11). Thus, in three decades an additional area almost the size of the canton of Neuchâtel was built on. However, during this period settlement growth gradually slowed down. Whereas in the period between 1985 and 1997, an annual average increase in settlement and urban areas of 27 km2 was seen, between 1997 and 2009 this figure had fallen to 23 km2 and between 2009 and 2018 to 20 km2.
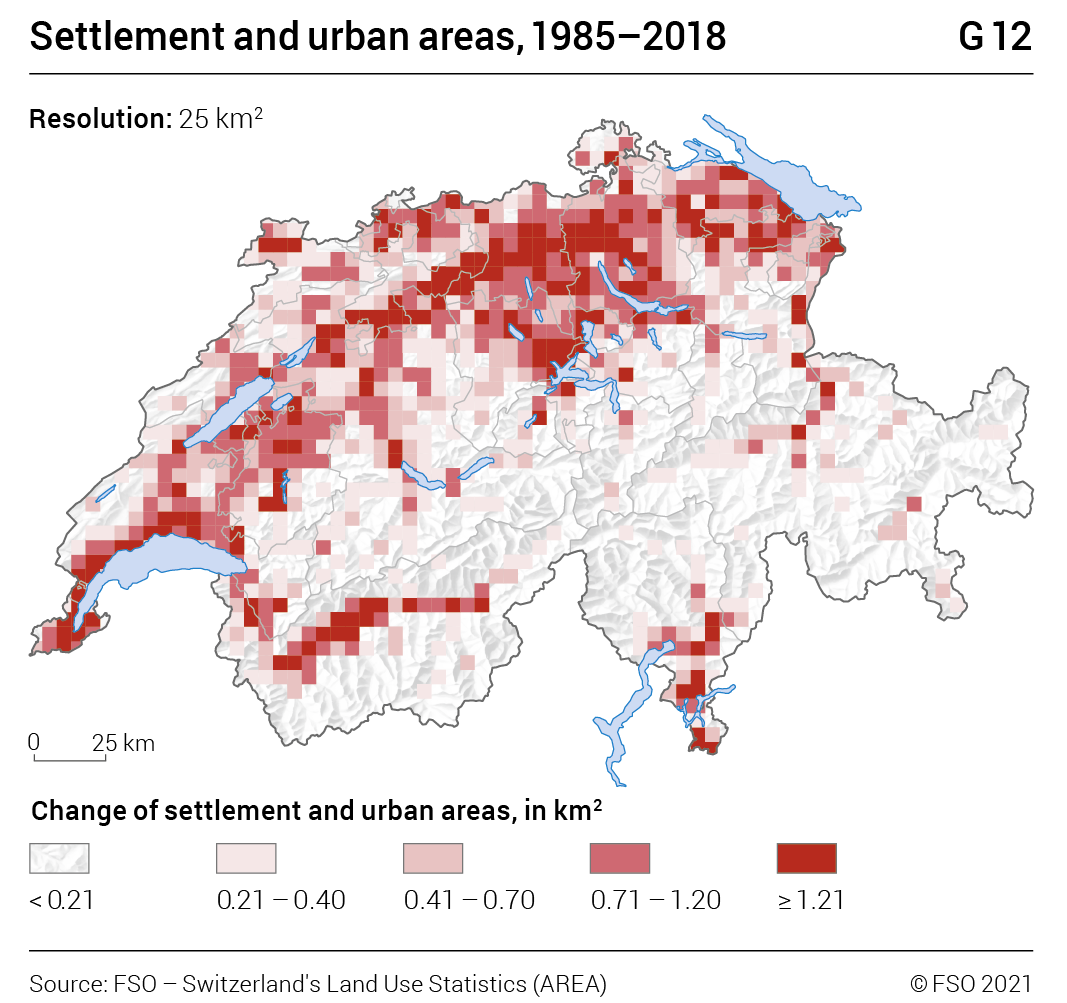
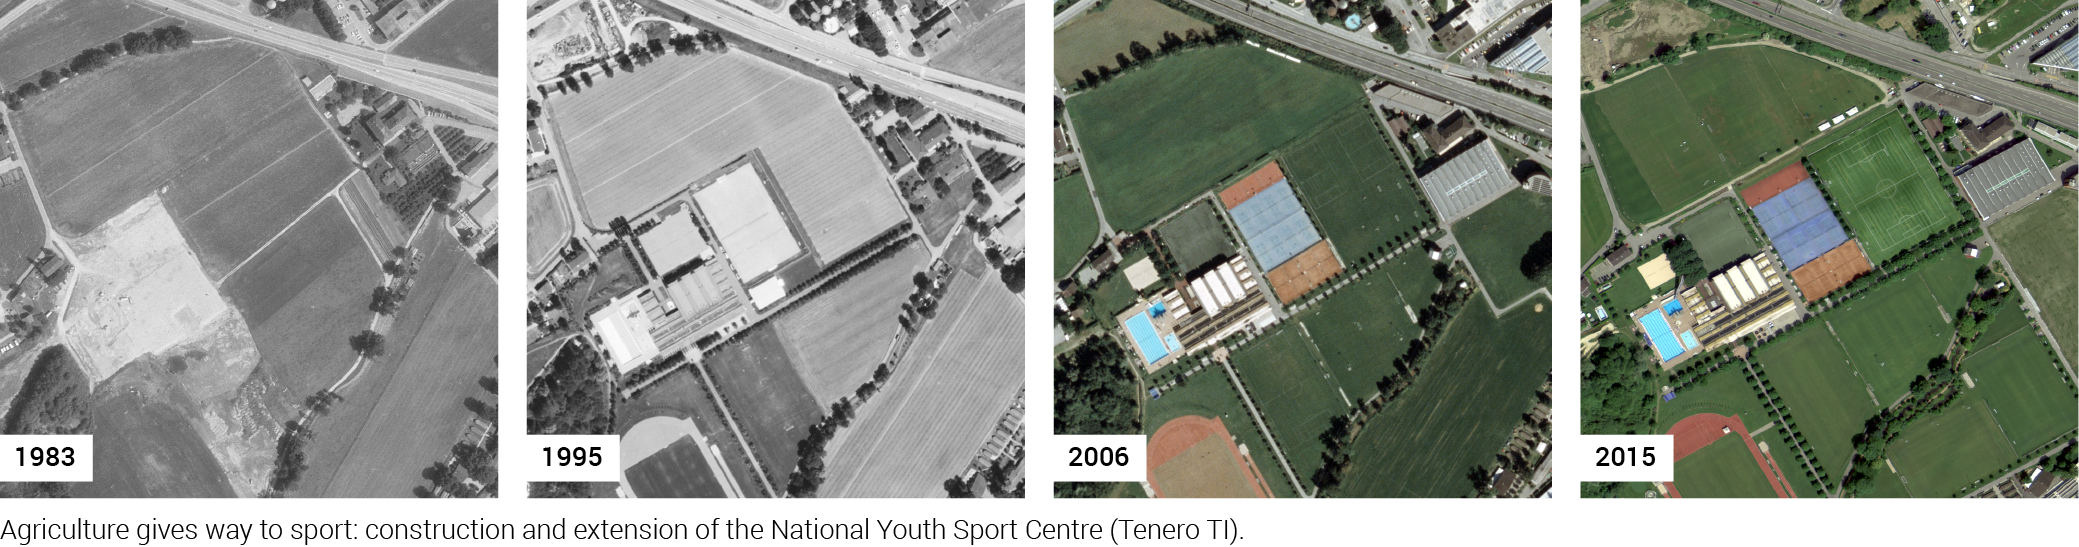
Between 1985 and 2018, growth in settlements was strongest in the agglomeration belts and in the major conurbations, such as the Olten-Winterthur-Lucerne triangle or between Geneva and Lausanne (G12). But settlement and urban areas also saw considerable growth in the rural areas of the Mittelland (in the Fribourg area and in the Lake Constance region), in the alpine valley plains and in parts of the Jura and the northern flank of the Alps. In the western Central Alps (Valais) at 49% the increase was even higher than the national average.
Not all types of settlement and urban areas grew at the same pace. Between 1985 and 2018, the residential area grew most – in terms of both absolute figures and percentage – namely by 434 km2 or 61% (G13). The area used for housing, therefore, grew considerably faster than the population. Recreational areas and cemeteries also showed high growth rates with +46% as did industrial and commercial areas with +41%. Much weaker growth was seen in the increase of the transportation area with +19% and other building areas with +14%. Over the observation period, the rise in the transportation areas was much weaker than that of vehicle stocks and kilometre performance. Special settlement areas even saw a 15% decline between 1985 and 2018. This was because several motorway sections were completed at this time and the corresponding major road works closed. In many places, gravel pits and dumps were also revegetated or rewilded.

Growth especially at the cost of cultivated land
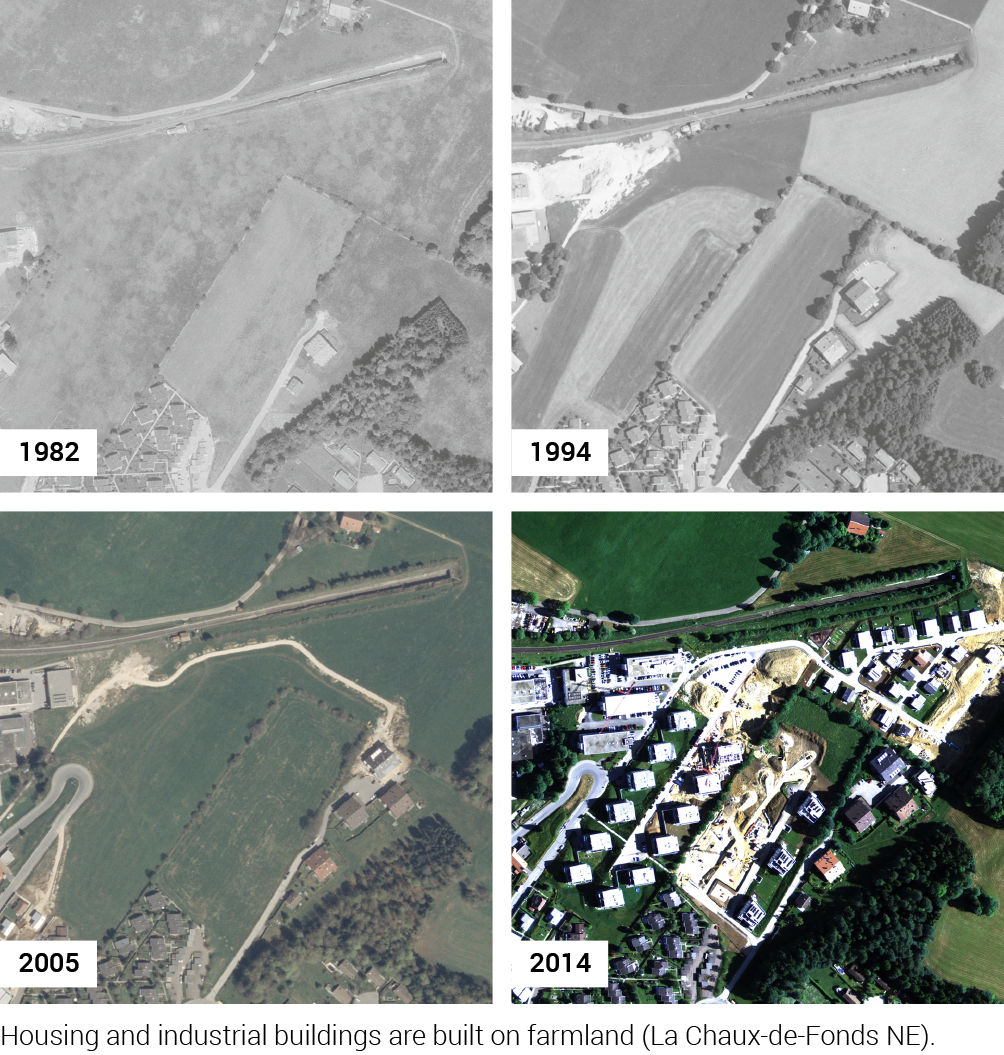
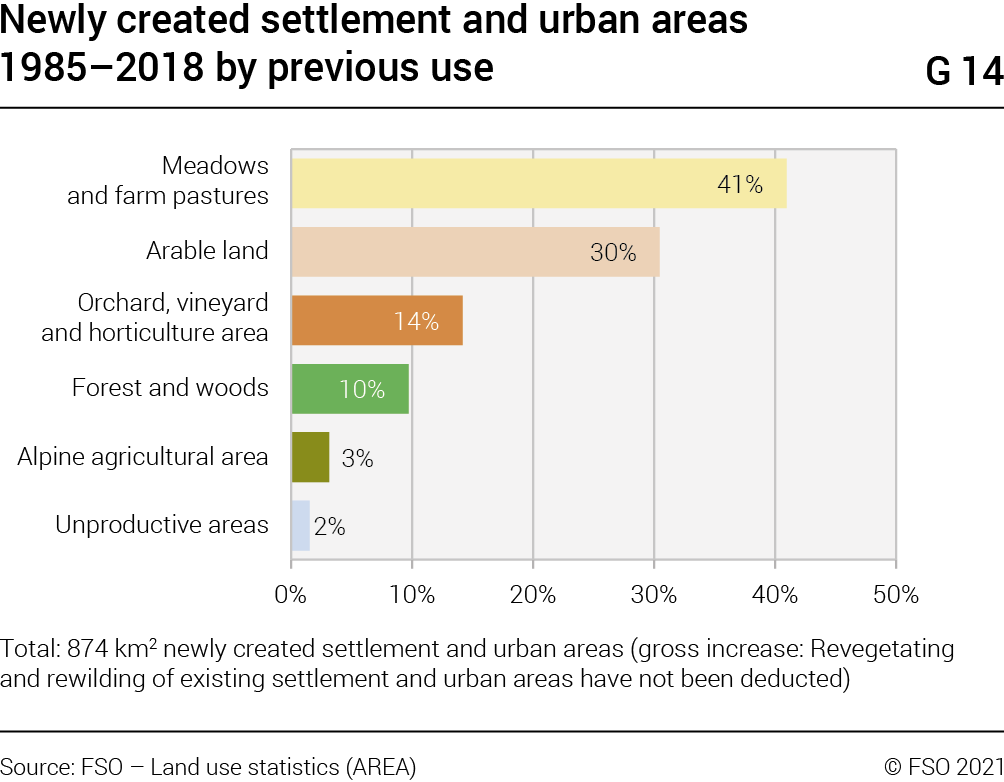
Nine tenths of the new settlement and urban areas were built between 1985 and 2018 on former agricultural areas. Just one tenth were built on land that had previously been covered with forest or woods or on so-called unproductive land (G14). This can be explained by the fact that existing settlements are usually surrounded by agricultural areas. Agricultural land does not enjoy the same legal protection as the forest, where a legal obligation exists to offset forest clearing. Unproductive areas on the other hand are mainly found in remote places and are therefore hardly affected in terms of surface area by the expansion of the built environment.
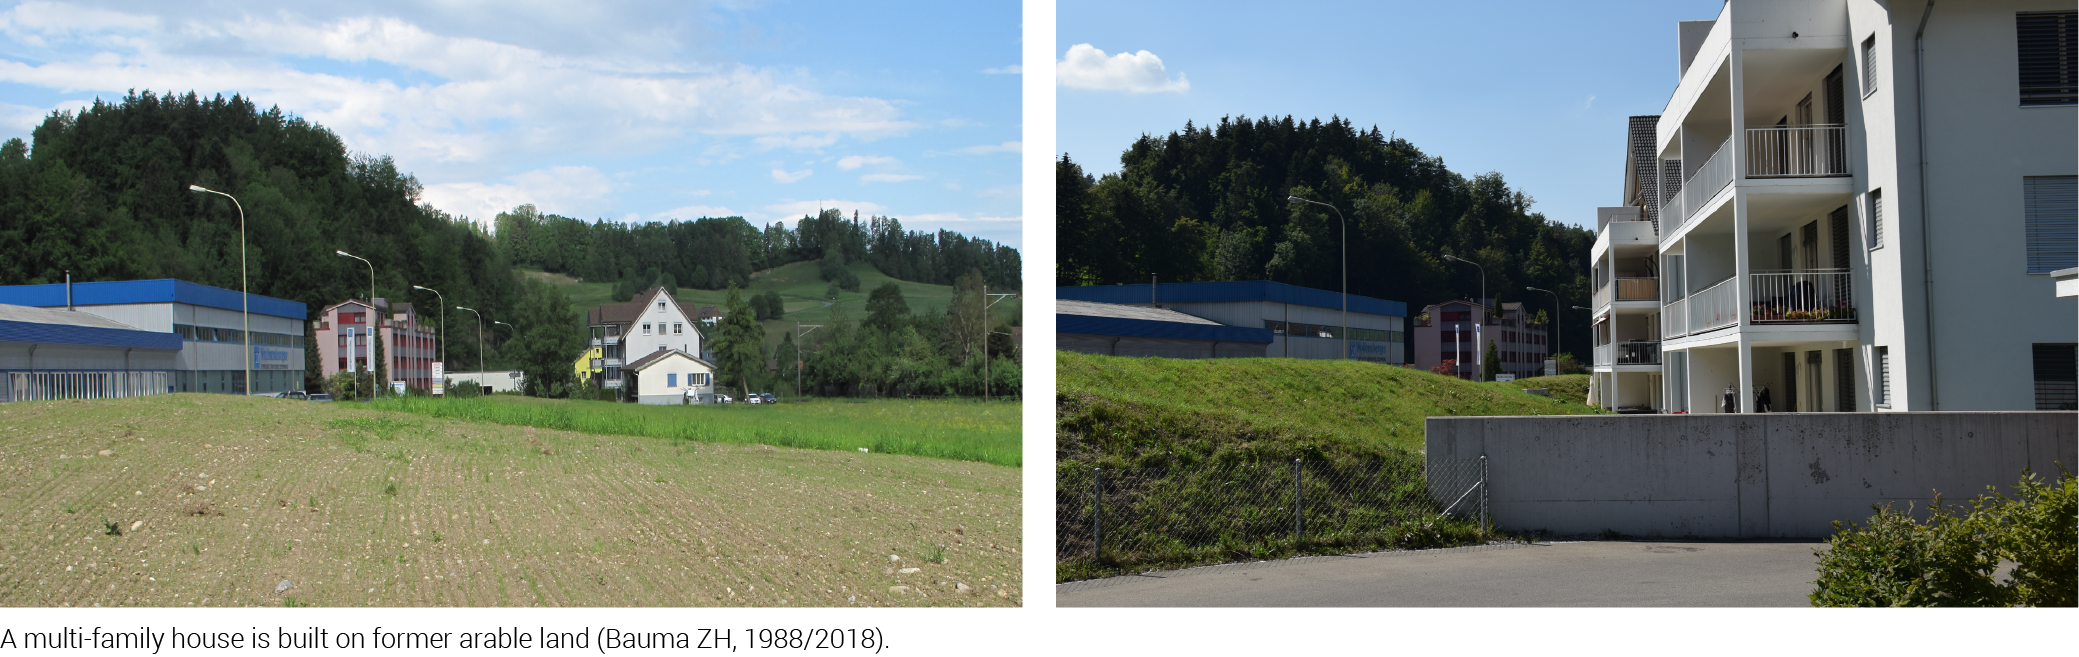
The type of usage that most frequently had to make way for new building developments depends on the type of the new settlement and urban area. Industrial and commercial areas, for example, grew in particular at the expense of the most fertile agricultural areas, arable land (G13). This is in no small part due to the fact that for large industrial buildings only very flat regions are generally considered. These same regions are also ideal for arable farming. The situation is different for residential buildings, as hillsides are suitable for their construction and due to good views and sunlight exposure can be especially sought after. As the new residential buildings there are mostly built on former meadows, farm pastures, orchards or vineyards, these categories together account for more than half of all usages superseded by the new residential area.
Rewilding and repurposing
Settlements are dynamic entities. Although in many places they increase in size, occasionally settlement and urban areas “disappear”, i.e. they are returned to another form of usage (G13). Such revegetating or rewilding has already been mentioned above in relation to abandoned gravel pits and dumps. They are, however, the exception to the rule: The total settlement and urban area that disappeared between 1985 and 2018 was a relatively modest 97 km2.
A larger area was concerned by shifts between the different types of settlement and urban areas: A total of 262 km2 of settlement and urban areas was used for another of the six different types of usage than was the case in 1985.
The population is growing – the residential
area even more so
The 61% increase between 1985 and 2018 in the residential area (residential buildings and surroundings) mentioned above means that the area used for housing increased in the past three decades almost twice as much as did the population (+32%) (G15). While in 1985 residential space consumption was 110 m2 per person, by 2018 this figure had risen to 134 m2. The main reasons for this are people’s increasing expectations in terms of dwelling size as well as a rise in small households of only one or two people. These trends have also led to a considerable increase in the living space per person (occupied interior surface) since the 1980s (1980: 34m2, 2018: 46m2, according to the FSO Building and dwelling statistics).

The disproportionate growth in residential areas compared with the population was offset by disproportionately low growth in other building areas, transportation areas and special settlement areas between 1985 and 2018 (cf. G13). For this reason, at +31%, overall settlement and urban areas grew at roughly the same pace as the population. Accordingly, the consumption of settlement and urban areas per inhabitant also remained almost unchanged. In 2018 it was 384 m2, compared with 386 m2 in 1985. In the years in between, however, it hardly rose above the 400 m2 mark.
First signs of dense building
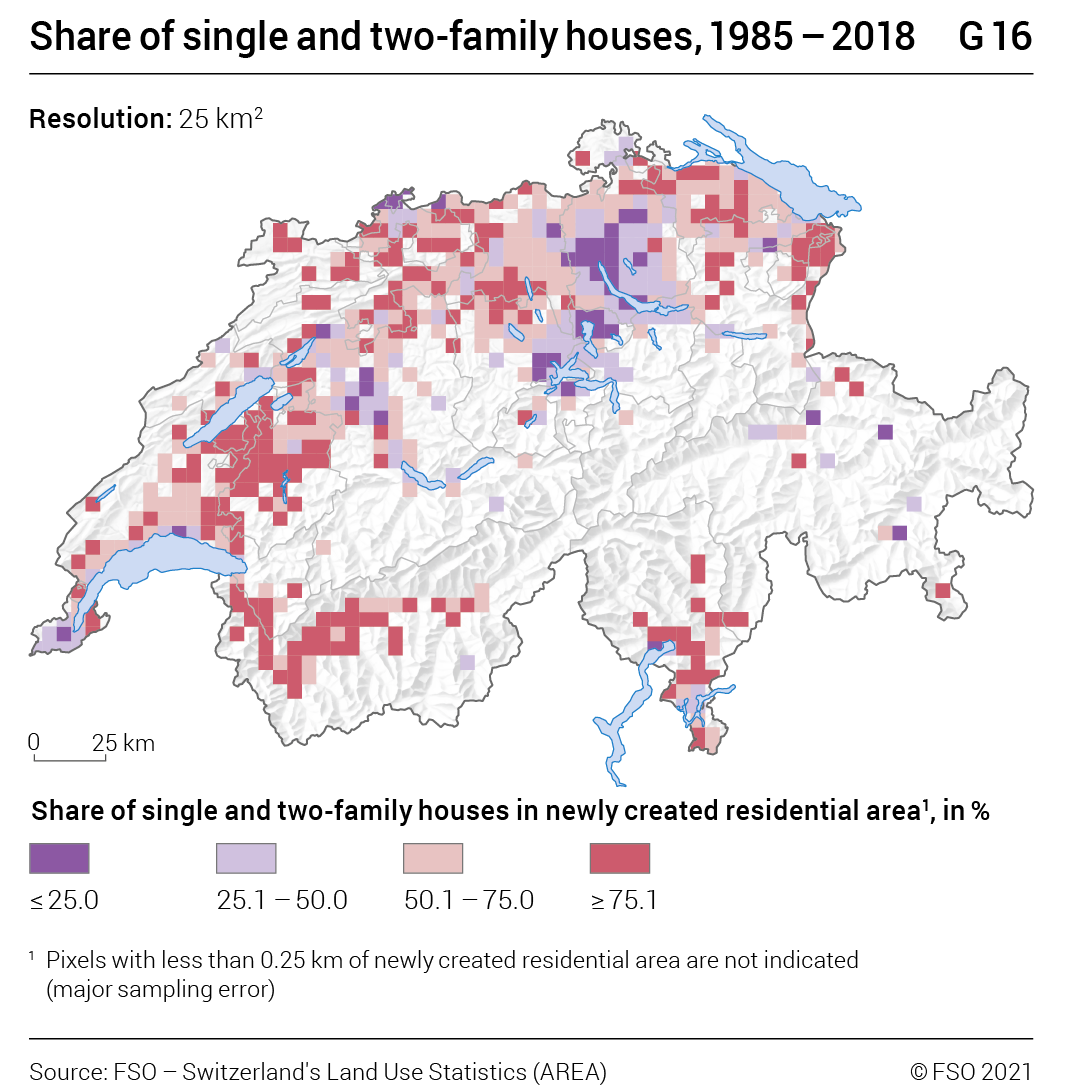
Despite the rapid growth in residential areas in the past three decades, statistical signs of a trend reversal can also be discerned towards a more economic use of the sparse land resources. The annual growth rates of single and two-family houses, which are especially wasteful in terms of land use, have actually declined in recent decades, while they have risen considerably for the space-saving multi-family houses. Proportionally, the fewest new single and two-family houses were built – unsurprisingly – in the urban centres and the surrounding fringe, where suitable building zones are rare and land prices are high (G16). The reduction in size of the land surrounding buildings can be seen as another indication of dense building. This can be observed at least for single and two-family house. While the building area to surrounding land ratio was 1:4.6 in 1985, it had fallen to 1:4.2 by 2018.
The trend towards a better utilisation of the residential area is confirmed further by the Buildings and Dwellings statistics, which also show a shift in construction activity in favour of (larger) multi-family houses. Residential buildings constructed between 2016 and 2019 have on average almost twice as many dwellings (4.1) as those built between 2001 and 2005 (2.1). Between 1981 and 2000 the average value was 2.4 dwellings per building.
Industry and commerce are moving
to the agglomeration belt...
Between 1985 and 2018, new industrial and commercial areas were mainly built in the agglomeration belts and close to motorway connections (G17). In particular transport and logistics firms, which need a lot of room for warehouses and vehicles, prefer to establish themselves close to motorways and railway lines.

... and disappearing from inner cities
Contrary to the general trend of growing industrial and commercial areas, in some places a reverse trend can be observed – especially in inner city or periurban areas where industrial and commercial areas have frequently declined, in some cities (Zurich, Basel, and Winterthur) to a marked extent. The “deindustrialisation” of city centres was already at its peak in the 1970s with the disappearance of traditional industrial areas (mechanical engineering or the textile industry, for example). The widespread conversion of these areas, however, only began in the 1990s, as the transition from agricultural area to building land in the towns reached its limits. The industrial and commercial areas abandoned between 1985 and 2018 were replaced essentially by new housing (26%), other building areas (22%) and transportation areas (18%). A substantial portion of them, however, are still waiting for a new purpose (empty buildings, cleared grounds and construction sites).
More roads, but much more traffic
In recent decades many new roads have been built and existing sections extended, mainly to connect the newly built residential, industrial and building areas to the road network. Across Switzerland, the road areas (traffic lanes and corresponding areas of grassland) grew by 124 km2 between 1985 and 2018, equal to five times the surface area of the Walensee. Nevertheless, expressed as a percentage, at +18%, the growth in the road areas is nowhere near that of the motor vehicle stock at +90% and of kilometre performance (kilometres covered by motor vehicles) at +59% (G18). Today there is considerably less road surface available per vehicle than was the case thirty years ago. With an increase of 68% between 1985 and 2018, above-ground parking areas have kept more in pace with the growth of the vehicle stock.

More space for playing golf, less for gardening
As we have already seen, recreational areas and cemeteries grew overall by 46% between 1985 and 2018. But a breakdown by individual types of use reveals major differences (G19). Extremely strong growth can be seen for golf courses, whose area more than quadrupled in the observation period (+325%). More than two-thirds of this increase took place, however, between the surveys of 1997 and 2009: since then the ‘golf boom’ seems to have diminished somewhat.

Other sports facilities also increased greatly between 1985 and 2018 (+40%) as well as public parks (+49%). In the same period only weak growth was seen in contrast for camping areas (+13%) and cemeteries (+8%); garden allotments even decreased in size (–13%).
Almost two-thirds of settlement
and urban areas are “sealed”
The green spaces within settlements are not only limited to the aforementioned recreational areas and cemeteries. Also private gardens, the often lushly planted land surrounding houses, the green strips alongside roads, etc., ensure that settlements are much more than a mosaic of tarmac and concrete. Settlements sometimes surpass areas used for agricultural or forestry in terms of biodiversity. Nevertheless, in 2018 almost two-thirds of settlement and urban areas, i.e. 63%, were “sealed”. This term is used to describe soils that have been covered with non-porous materials, thus robbing them of the majority of their ecological function (filtering and retaining water, breakdown of pollutants, etc.). The degree of sealing varies by type of settlement area and is particularly high (88%) for industrial and commercial areas as well as for transportation areas (85%) (G20). Comparatively very low values are shown, unsurprisingly by recreational areas and cemeteries (23%) as well as special urban areas (32%). The low degree of sealing of special urban areas can be explained by the fact that this category includes building sites, quarries and dumps which contain much open soil – which is, however, seldom “green”.

Sealing has recently gathered speed again
In parallel to settlement growth, sealed areas have increased greatly in the past decades rising from 1487 km2 in 1985 to 2081 km2 in 2018 (+594 km2). While during the period between 1985 and 1997, an average of 19.4 km2 soil was sealed for the first time per year, this value fell in the period 1997–2009 to 16.9 km2, only to rise again in the most recently available observation period, the years between 2009 and 2018 to 17.6 km2 (G21). The trend in recent years, therefore, has taken a different direction to that envisaged in the “Swiss National Soil Strategy” approved by the Federal Council. The strategy’s first goal is namely to reduce net annual land consumption to zero by 2050, using the degree of soil sealing as an indicator. Soil sealing as an indicator for land consumption will be replaced at a later stage by a national land function map. See: Swiss Federal Council (2020): Swiss National Soil Strategy, Bern, p. 22.
