Switzerland’s transport infrastructure is well developed in international comparison. It covers 2%
of Switzerland’s territory and about a third of its settlement and urban areas (according to the
Land use statistics 2004/09). Amongst other infrastructure, there are 5196 km of railway lines
(situation in 2015) and 83 274 km of roads (2020) of which
1544 km are motorways across the
country.
Daily mobility, 2015Average per person1 per day, in Switzerland
| Total | 36.8 | 82.2 | Means of transport | ||
| On foot | 1.9 | 29.8 | |||
| Trip purposes | Bicycle | 0.8 | 4.0 | ||
| Work and education | 10.8 | 20.2 | E-bike | 0.1 | 0.3 |
| Shopping | 4.8 | 11.5 | Motorcycle (incl. moped) | 0.5 | 1.0 |
| Leisure | 16.3 | 42.2 | Car | 23.8 | 33.9 |
| Business travel | 2.6 | 3.8 | Bus (incl. postal bus) | 1.1 | 3.4 |
| Tramway | 0.4 | 1.5 | |||
| Giving people lifts | 1.8 | 3.4 | Train | 7.5 | 6.7 |
| Other | 0.7 | 1.1 | Other | 0.7 | 1.8 |
1 Permanent resident population of Switzerland aged 6 years and over
2
Excluding waiting and transfer times
Commuter traffic
Some eight out of ten employed persons in Switzerland were commuters in 2019, i.e. people who leave the building in which they live to get to their place of work. Of this number, 71% worked outside the commune in which they live.
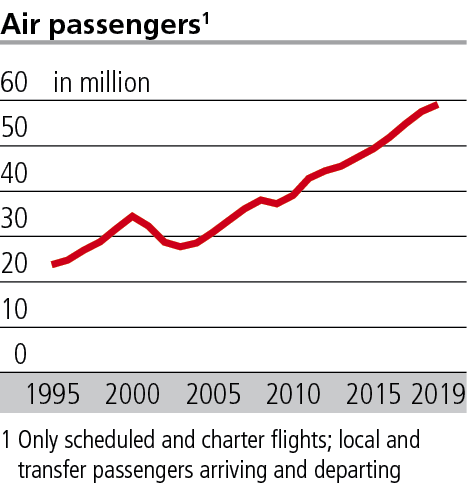
Number of air passengers
In 2019, Swiss airports recorded 59 million individual arrivals and departures on scheduled and
charter flights. This was
24 million or 70% more than in 2000.
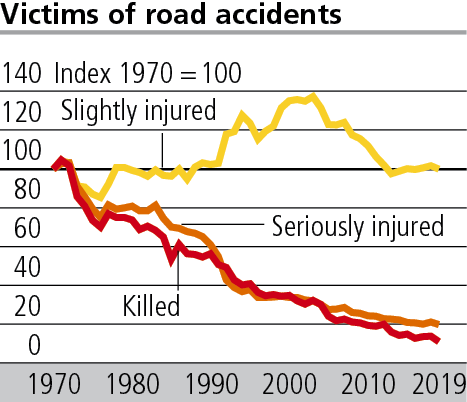
Accident victims by mode of transport 2019
| Road traffic | |
| Persons killed | 187 |
| Persons seriously injured | 3 639 |
| Persons slightly injured | 17 641 |
| Rail traffic | |
| Persons killed | 17 |
| Air traffic (civil aviation only) | |
| Persons killed | 11 |
Transport costs and funding
In 2017, transport in Switzerland generated total costs of CHF 92.7 billion (excluding waterways). In addition to expenditure on means of transport (59%) and infrastructure (16%), this also included the cost of accidents (12%) and costs for transport-related damage to the environment and health (13%).
Costs and funding of transport 2017
| Total costs, in CHF bn |
User finan-cing, in % | |
|---|---|---|
| Road 1 | 74.3 | 86 |
| Rail | 11.7 | 45 |
| Air 2 | 6.7 | 80 |
| Waterways 3 | 0.3 | 64 |
1 Excl. human-powered mobility
2 Excl. general aviation
3 Status in
2015
► www.statistics.admin.ch → Look for statistics → Mobility and Transport