2.1 Tourist accommodation in Switzerland
2.1.1 Demand in tourist accommodation
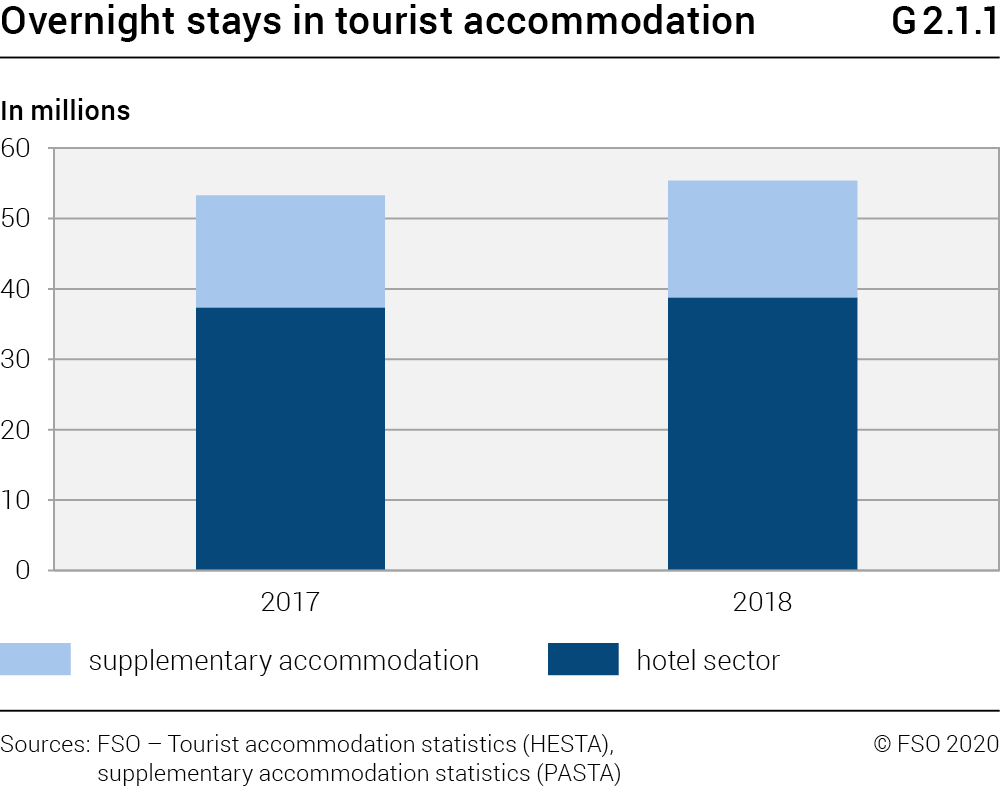
In 2018, tourist accommodation in Switzerland – that includes the hotel sector and supplementary accommodation – counted a total of 55.4 million overnight stays (G2.1.1). This corresponds to a rise of 3.9% compared with the demand from 2017. The hotel sector represents the largest share of the demand with just over 70% of overnight stays recorded.
2.1.2 Swiss and foreign demand
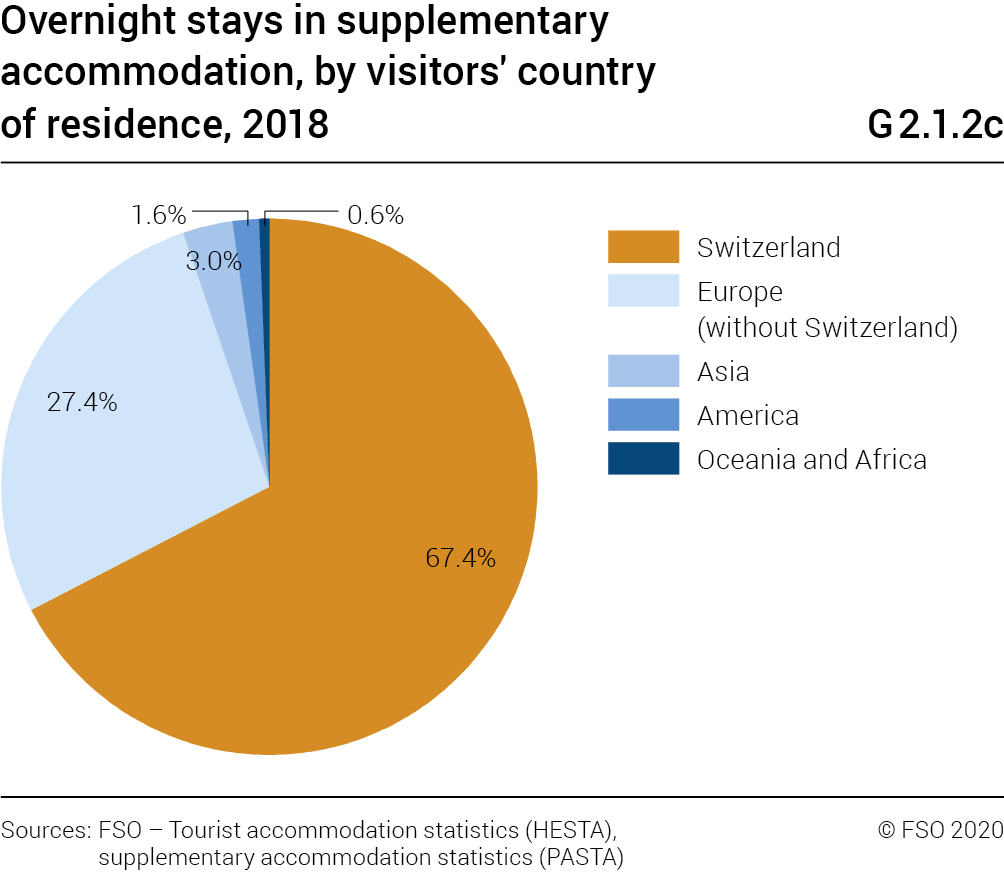
Swiss clientele accounted for 51.6% of the overnight stays recorded in Swiss tourist accommodation in 2018 (G2.1.2a). In terms of foreign demand, European visitors generated the most overnight stays with just over 30% of the total demand. Demand for supplementary accommodation mainly came from Swiss visitors (more than 65%) (G2.1.2b), while in the hotel sector, Swiss demand was less substantial (44.9%) (G2.1.2c).
Did you know?
In 2018, more than 150 000 overnight stays (151 644) were counted on average every day in Swiss tourist accommodation.


2.1.3 Breakdown for monthly demand
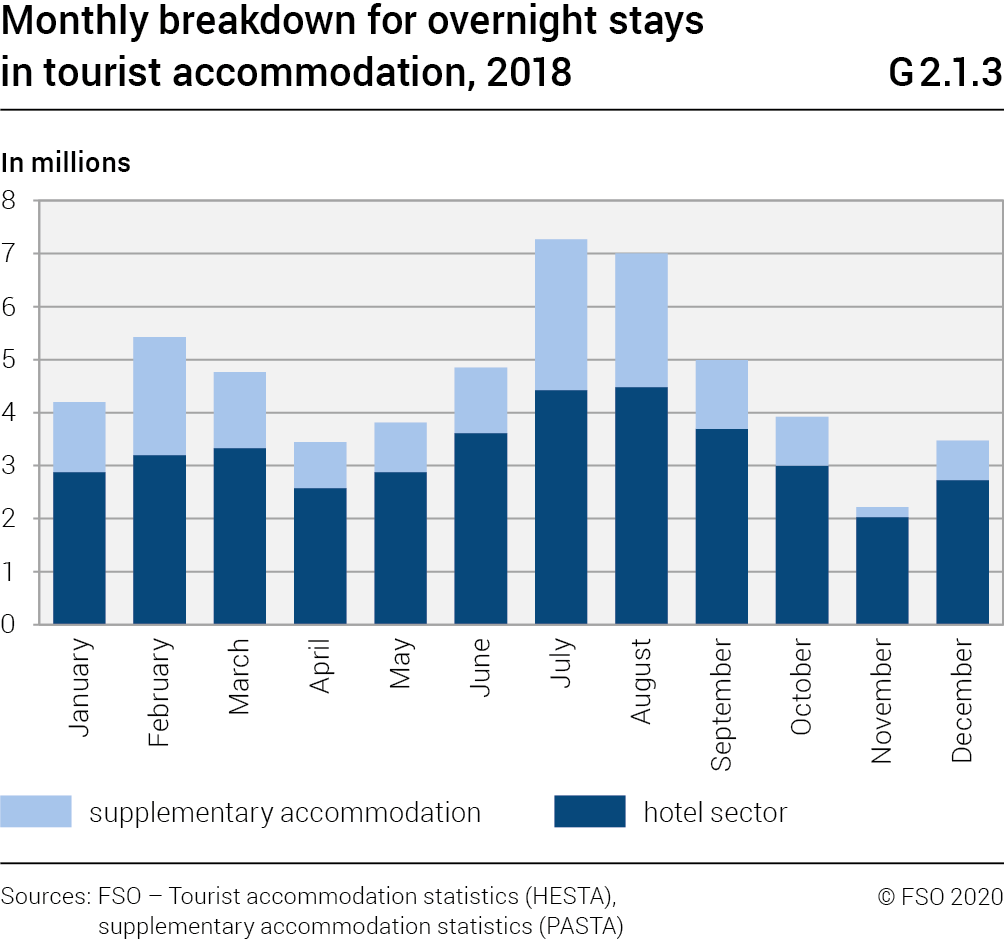
In tourist accommodation in Switzerland in 2018, the greatest number of overnight stays was recorded in the months of July and August (G2.1.3). 14.3 million overnight stays were counted in these months alone, i.e. 25.8% of the annual demand.
2.1.4 Change in demand in the countries neighbouring Switzerland
In comparison with the European results (EU28), Swiss tourist accommodation in 2018 showed an analogue but nonetheless more marked development in overnight stays (G 2.1.4) with an increase of 3.9% (versus 2.9% in the EU28) in relation to 2017. Increases were also observed in neighbouring countries (Germany, France, Italy and Austria).
In 2018 at European level, the number of overnight stays generated by both non-residents and residents grew (+3.7% and +2.1% respectively, compared with 2017). This trend has been also observed for all countries neighbouring Switzerland. For Switzerland, the scenario was virtually identical: overnight stays showed an increase both by residents (+5.0%) and non-residents (+2.9%).

2.2 Hotel sector results
2.2.1 Supply in 2018
In 2018, there were, on annual average, 4275 open hotels and health establishments in Switzerland, corresponding to 130 049 rooms and 251 679 beds available (G2.2.1a). The distribution of the establishments differed according to the tourist regions. Graubünden had the largest proportion (14.2%), followed by the Bern Region (13.2%). The national average capacity of a hotel establishment was 59 available beds (G 2.2.1b).
Did you know?
With 130 beds on average per establishment, Geneva had the highest number of beds in Switzerland in 2018.


2.2.2 General change in supply
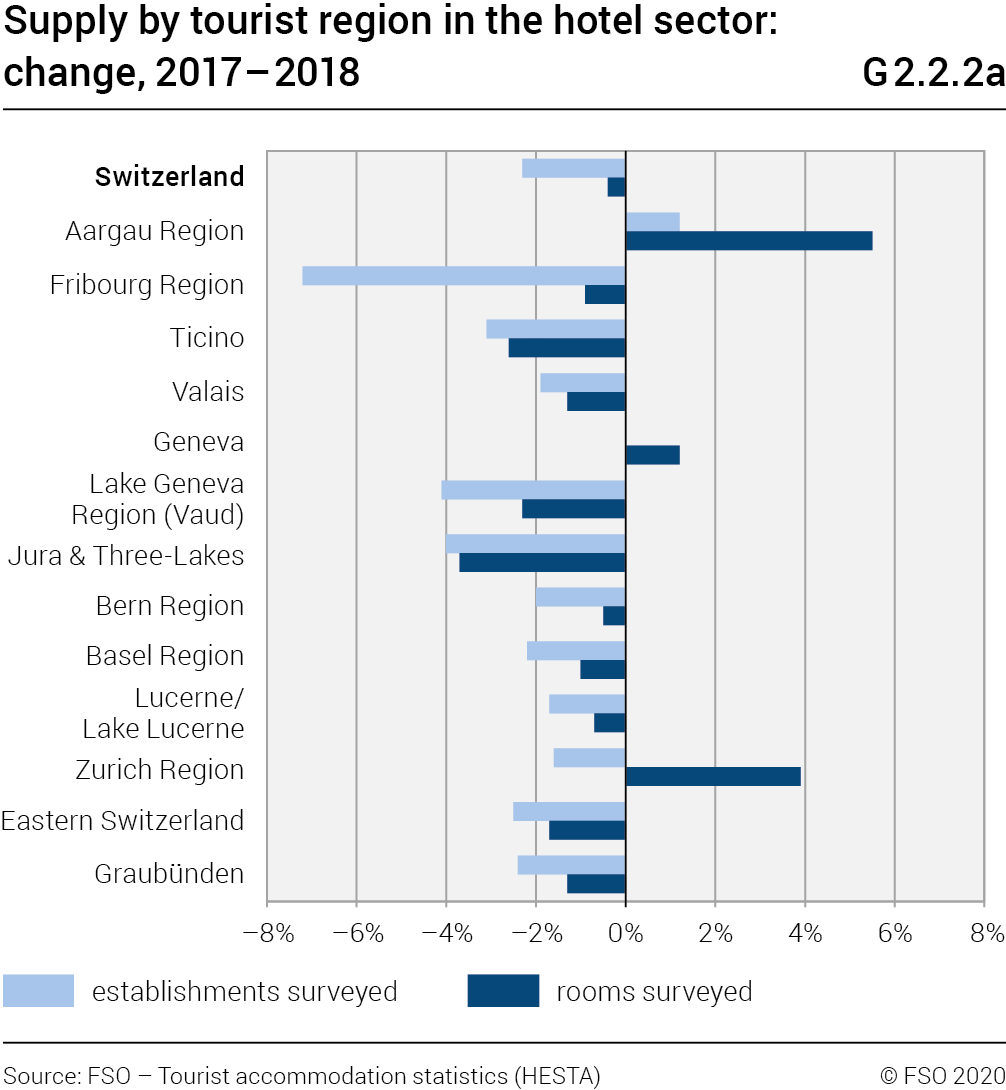
In 2018, a total of 4765 establishments and 140 884 rooms were surveyed in the hotel sector in Switzerland. The number of establishments decreased in comparison with 2017 (–113 establishments/–2.3%) (G2.2.2a) as did the number of rooms (–520 rooms/–0.4%). Among the tourist regions, the supply, in terms of establishments, also declined in 11 in 13 regions between 2017 and 2018. As far as the number of rooms was concerned, 10 in 13 tourist regions followed the same trend as that observed at national level.
Over a comparative period of 10 years (G2.2.2b), the number of surveyed establishments diminished greatly. Thus in 2009, the number of surveyed establishments totalled 5533 in Switzerland, corresponding in absolute terms to a decline over this period of 768 units (–13.9%). As far as the number of rooms was concerned, a drop could also be observed in comparison with 2009 but this was much less marked than for the number of establishments (–1667 rooms/–1.2%). For this period, all the tourist regions saw a decrease in supply for the number of establishments. Eastern Switzerland registered the greatest decline with 126 fewer establishments (–20.1%). Of the 8 regions registering a decrease in the number of rooms, Ticino registered the greatest decline (–1707 units/–16.0%).
Did you know?
Over a 10 year period, the Zurich region saw the number of rooms surveyed increase by over 23% (+3557 rooms).

2.2.3 General trend in demand
To better appreciate the results of the demand in the hotel sector in Switzerland, these should be correlated with the striking economic events which have occurred over the past ten years.
This decade has been marked by economic growth at international level with the exception of 2009 (a year during which the decrease can be attributed to the world economic crisis). At national level, the year 2011 was characterised by a strong rise in the Swiss franc's value against the Euro and other currencies (cf. G 5.7). On 6th September 2011, the introduction of the minimum exchange rate by the Swiss National Bank (SNB) stabilised exchange rates, which nonetheless remained far lower than in previous years. On 15th January 2015, the SNB announced the end of the minimum exchange rate, resulting in renewed strength of the Euro compared with the Swiss franc. In the following two years, although the Swiss franc regained some ground against the Euro it never reached its pre-2015 level.
Over the past ten years, the evolution in the total number of overnight stays in hotels and health establishments in Switzerland has been diverse (G2.2.3). While 2008 saw a result close to the record set in 1990, a strong decline in demand was observed in 2009 (–4.7% compared with the previous year). Despite a slight recovery in 2010 (+1.7%), the number of overnight stays fell again in 2011 and in 2012 (–2.0% for each year). The trend was reversed for the years 2013 (+2.5%) and 2014 (+0.9%), however renewed decreases were observed for the years 2015 (–0.8%) and 2016 (–0.3%) A strong improvement in demand was seen in 2017 (+5.2%) which continued in 2018 with a total of 38.8 million overnight stays recorded (+3.8%).
Did you know?
The number of overnight stays registered in 2018 (38.8 million) was the best result ever seen.

2.2.4 Change in domestic and foreign demand
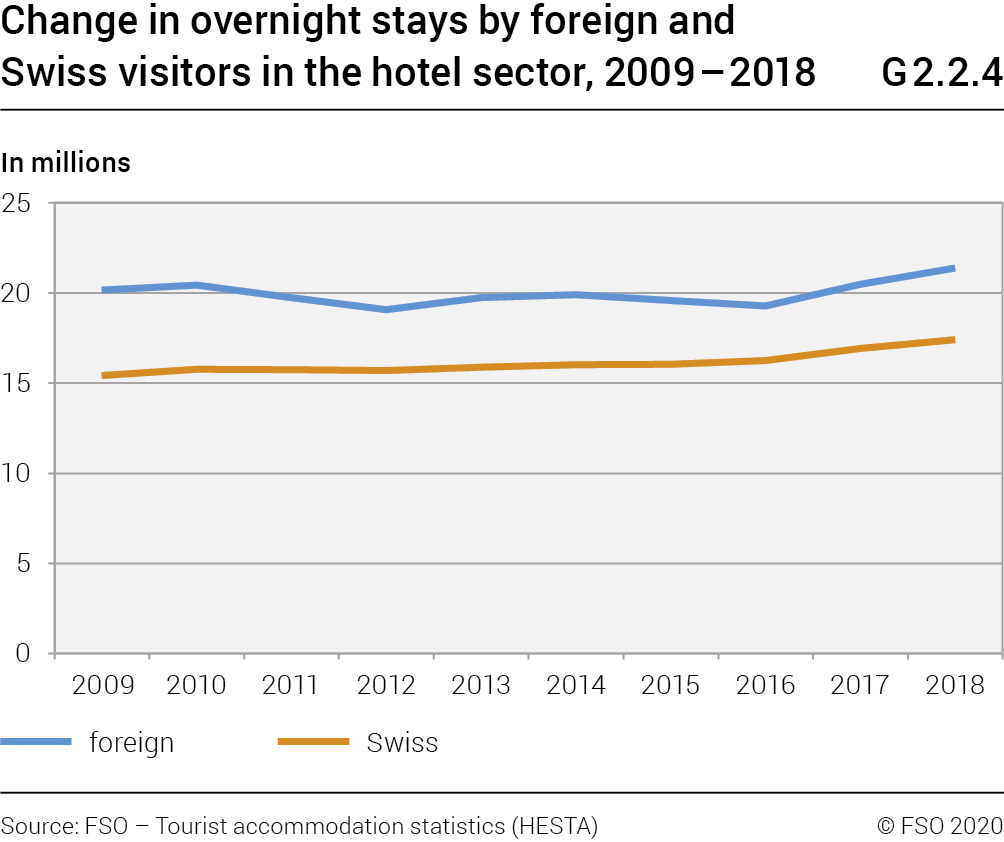
Looking back on the past 10 years, foreign and domestic demand in the hotel sector generally followed the same trends in 2009 and 2010 (G2.2.4). From 2011 to 2012, however, differences were seen between both types of demand. On the one hand, domestic demand was quite stable although foreign demand showed a sharp decrease (2011; –3.5%/2012; –3.3%). In 2013, however, a positive trend was observed for both types of demand. This continued in 2014. Although the increase in overnight stays for Swiss clientele continued in 2015 and 2016, demand from foreign clientele saw a significant decline once again. In 2017, both foreign (+6.1%) and domestic demand (+4.2%) registered a strong increase. This situation continues in 2018. Foreign visitors generated 21.4 million overnight stays, i.e. an increase of 4.5%, while Swiss visitors accounted for 17.4 million, representing an increase of 2.9%.
Did you know?
In 2018, Swiss demand exceeded the symbolic threshold of 17 million overnight stays for the first time (17.4 million).
2.2.5 Change in demand from Europe
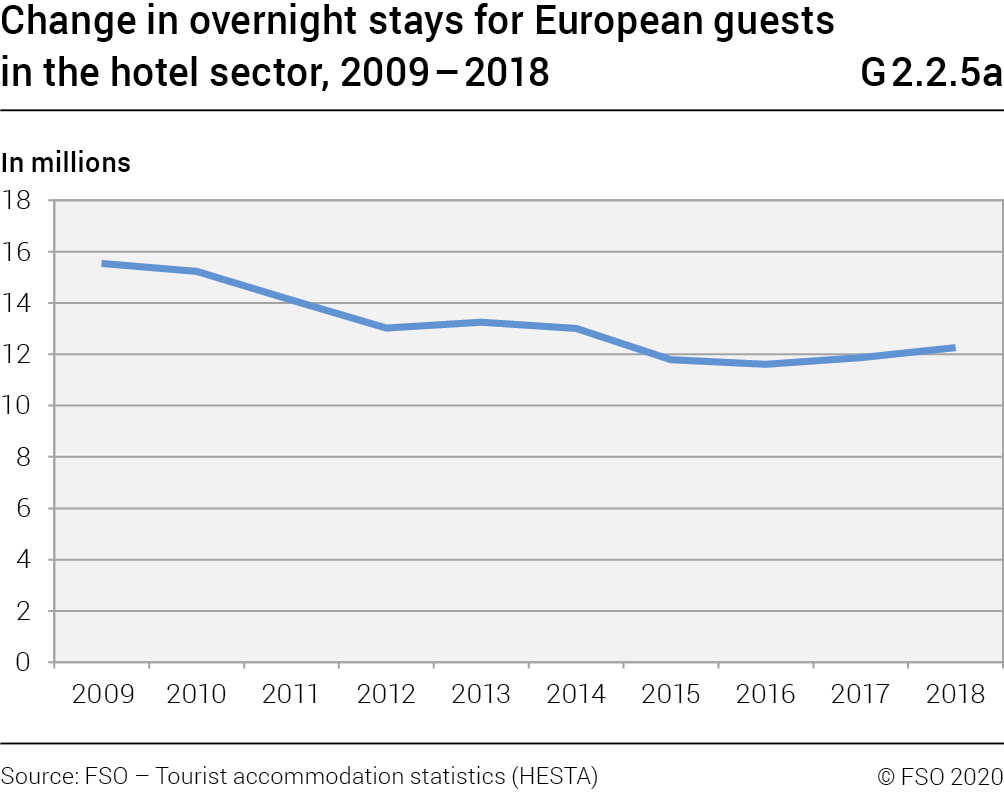
In 2018, demand from Europe (excluding Switzerland) registered 12.3 million overnight stays, representing an increase of 3.3% (+393 000 overnight stays) compared with 2017 (G2.2.5a). Nonetheless, over the past ten years apart from 2013 and 2017, this increase was an exception. Demand from European guests has seen sharp annual decreases over this period. Between 2009 and 2018, overnight stays by these visitors fell by more than 20%.
Among the main visiting countries from this continent (those with more than 600 000 overnight stays in 2018), Germany was emblematic of this change (G2.2.5b). As of 2009, visitors from this country have registered continued declines in overnight stays (with the greatest decrease seen in 2015 with –12.3% compared with 2014). Despite a slight improvement in 2017 (+1.1%) and in 2018 (+3.9%), overnight stays by this clientele have fallen by 35.5% since 2009. The Netherlands also followed the same trend and registered a strong decrease during this period (–38.3% between 2009 and 2018). In general, for the other main visiting countries, despite rises for some of these, the decrease between 2009 and 2018 remained strong.
Did you know?
Almost a third (31.6%) of the total number of overnight stays in the hotel sector was generated by European clientele in 2018.

2.2.6 Change in demand from Asia
In 2018, demand from Asian visitors in the hotel sector registered 5.4 million overnight stays (G2.2.6a). This result represents a rise of 4.8% compared with 2017. In ten years, demand from these visitors has seen strong growth, especially from 2010 onwards, with annual increases even reaching 18.6% in 2015. The only exception was 2016 in which a slight drop was observed (–3.4%).
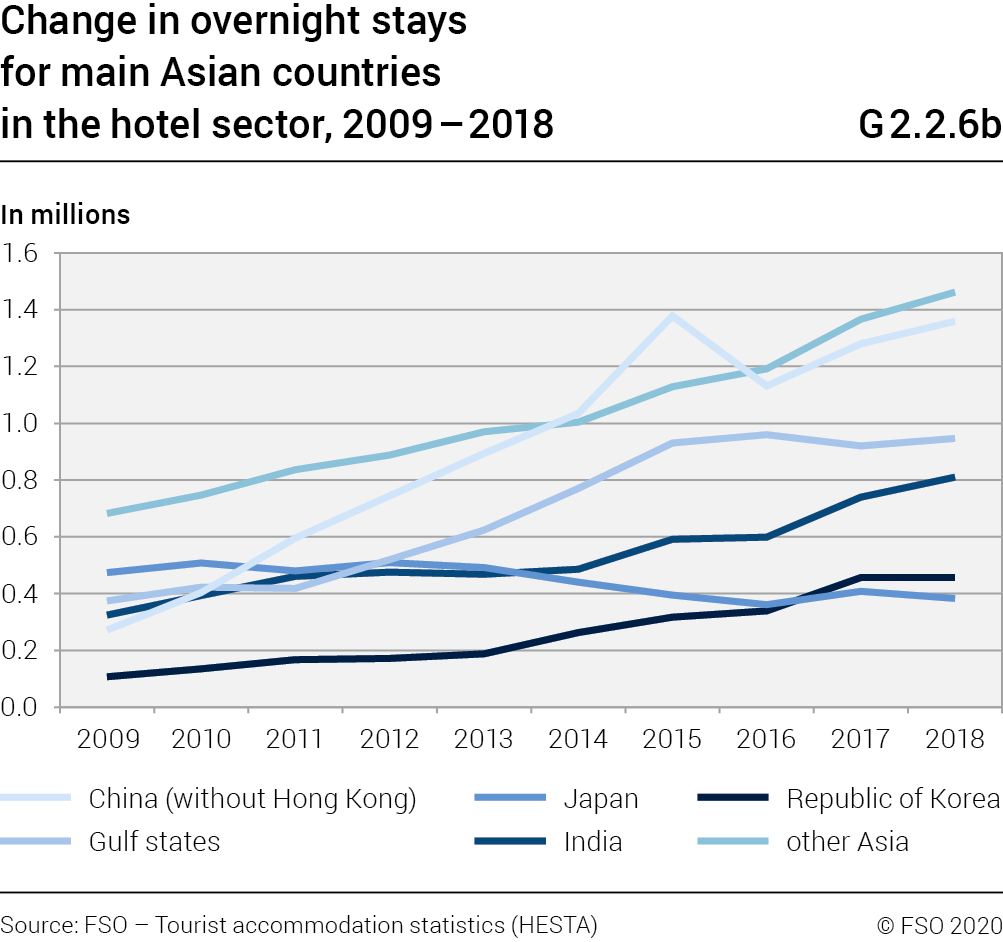
Among the leading countries of origin from the Asian continent (those with more than 350 000 overnight stays in 2018), three countries stand out for their very strong growth over the past ten years (G2.2.6b). Firstly, overnight stays by Chinese clientele (excluding Hong Kong) increased from 272 000 overnight stays in 2009 to 1.4 million in 2015, i.e. the highest level ever registered. This result declined slightly in 2016 but once again was very close to this record in 2018. Like India, the Gulf countries have also observed a very marked increase with more than twofold growth in overnight stays over this period. In contrast, Japan, which was still the greatest contributor to demand from the Asian continent in 2009 with 475 000 overnight stays (close to the 600 000 units seen in 2006), has slowly but steadily seen its number of overnight stays fall. Despite the improvement seen in 2017 (+13.1%) the number overnight stays fell once again in 2018 (-6.3%), reaching 383 000 units.
Did you know?
In 10 years (2009–2018), demand from Chinese guests (excluding Hong Kong) quadrupled.

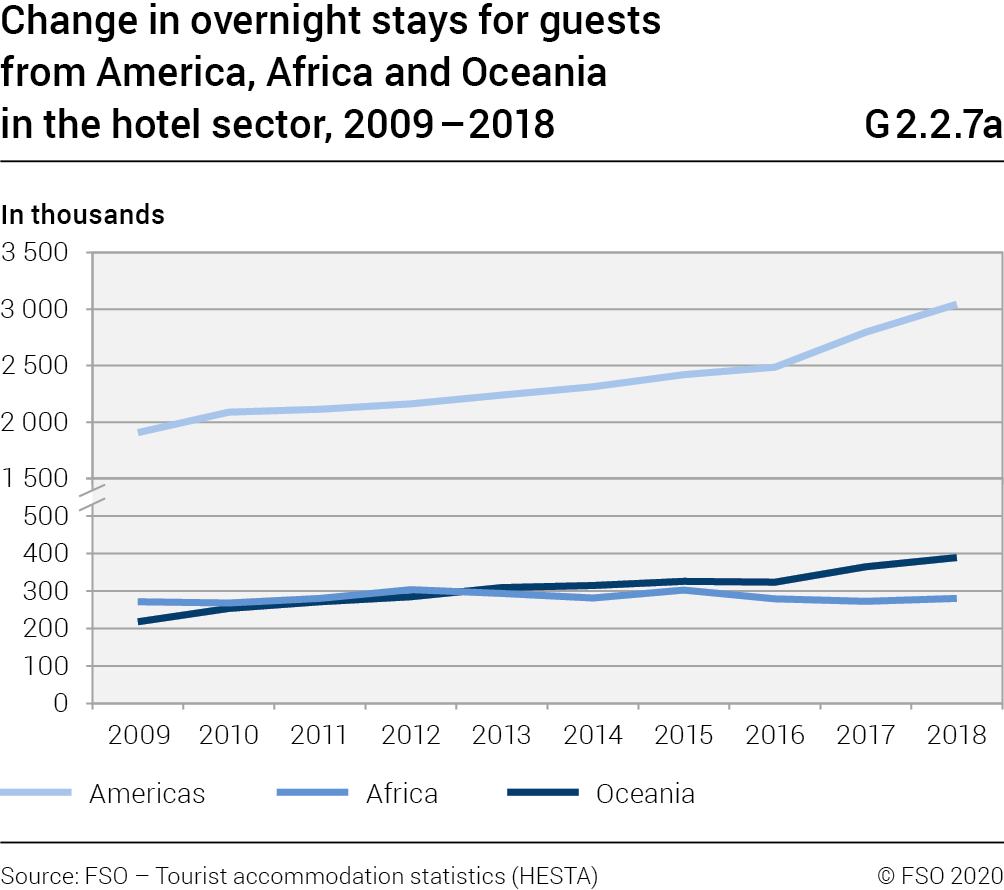
2.2.7 Change in demand from America,
Africa and Oceania
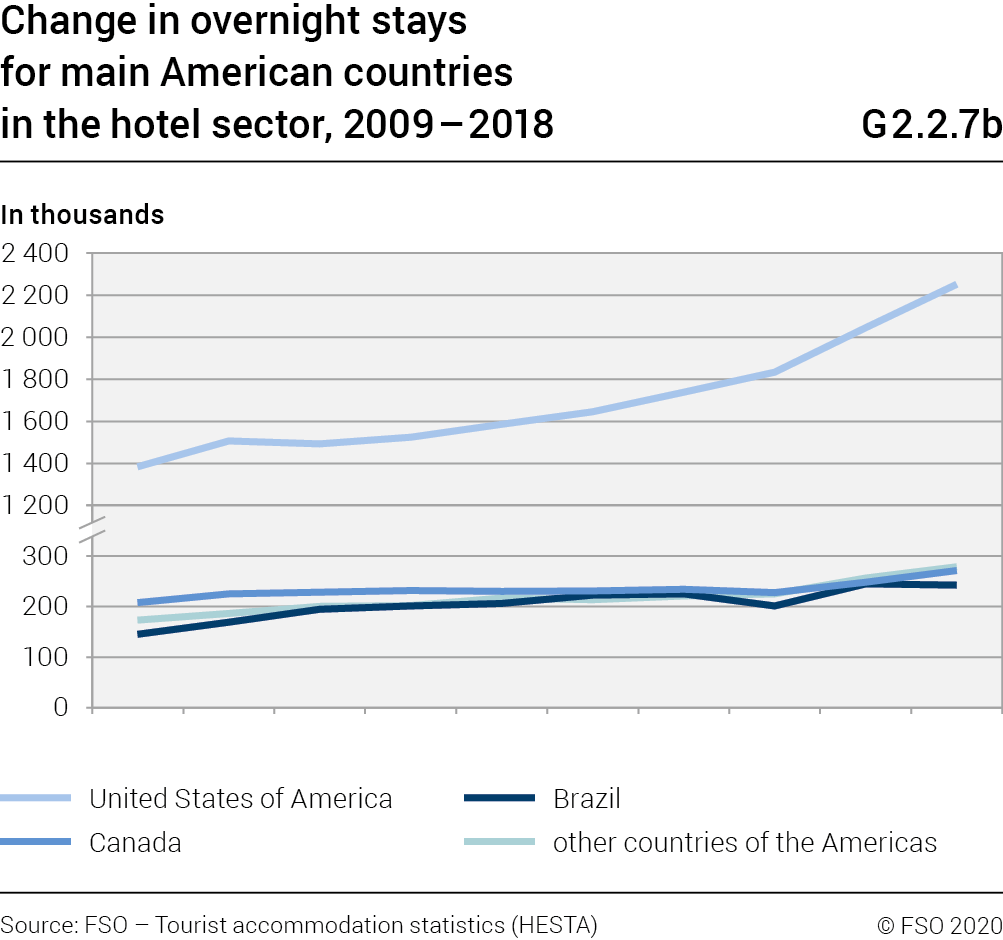
In the hotel sector, demand from visitors from the American continent registered a total 3.0 million overnight stays in 2018, i.e. an increase of 8.9% compared with 2017 (G2.2.7a). Since 2010, overnight stays by visitors from this continent have regularly increased, the total number of overnight stays in 2018 was almost 60% higher than their total number in 2009. For 2018, visitors from the United States, who constituted the greater part of the demand from this continent with almost 75% of overnight stays, generated more than 2.3 million overnight stays i.e. growth of 10.1% compared with 2017 (G2.2.7b). In 2018, visitors from Oceania posted 389 000 overnight stays (+6.5%) and those from Africa 280 000 units (+2.8%).
Did you know?
In 2018, the overnight stays generated by visitors from the United States reached 2.3 million, which has not happened in the hotel sector since the year 1990.
2.2.8 Change in demand by tourist region
In 2018, eleven of the thirteen tourist regions saw the number of their overnight stays in the hotel sector increase compared with the previous year (G2.2.8). Among these regions, the Zurich Region saw the sharpest increase with an additional 325 000 overnight stays (+5.4%). This was followed by Graubünden (+279 000 /+5.7%) and the Bern Region (+256 000/+5.0%). In contrast, Ticino recorded a marked decrease of 184 000 overnight stays, i.e. a decrease of 7.5%. However, considering the last five years as a whole, the good results for 2017 and 2018 were an exception for some regions. This was mainly the case for Graubünden and Valais that saw consecutive annual declines between 2014 and 2016. In contrast, 2018 was in keeping with continuity for most city regions: the Zurich region took the top spot with an increase of 884 000 overnight stays (+16.4%) between 2014 and 2018.
Did you know?
In 2018, the largest six tourist regions in terms of the volume of overnight stays recorded increases of 5% and over.


2.2.9 Duration of stay
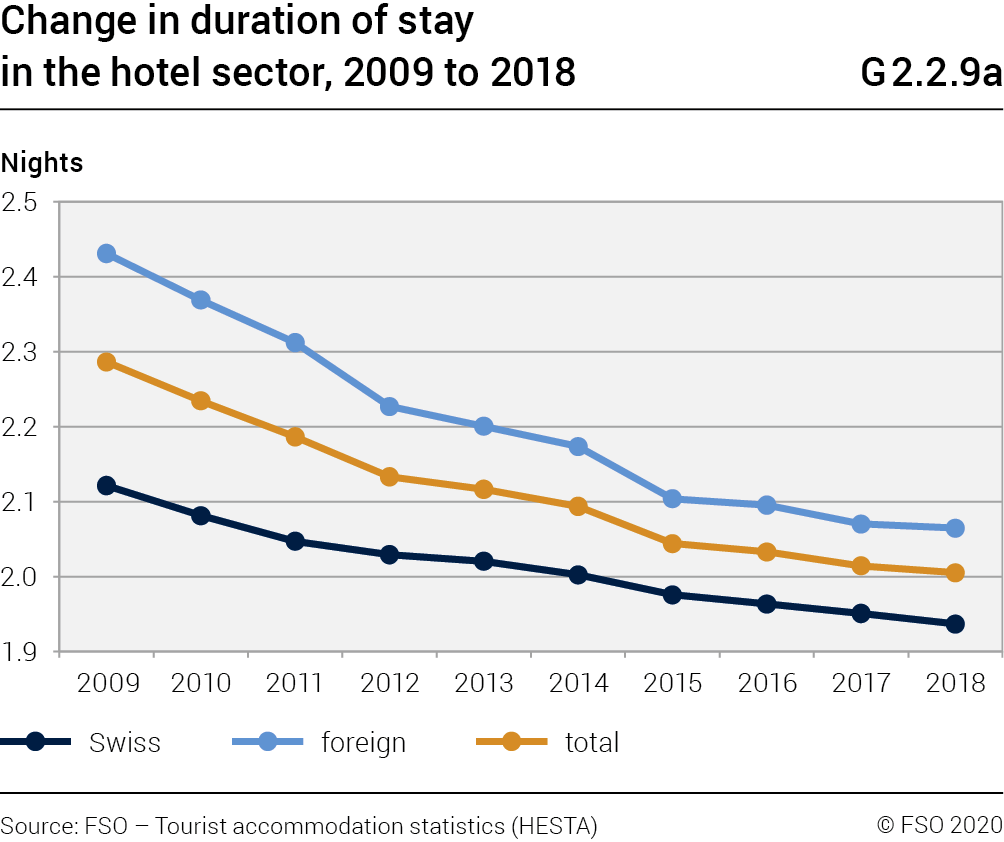
In 2018, visitors stayed an average of 2.01 nights in hotels and health establishments in Switzerland. This duration was, however, longer for foreign visitors with 2.06 nights than for Swiss visitors with 1.94 nights.
Over the past ten years, the length of stay at nationwide level has gradually decreased (G2.2.9a). In 2009 it was 2.29 nights with a duration of 2.43 nights for foreign visitors and 2.12 nights for Swiss visitors.
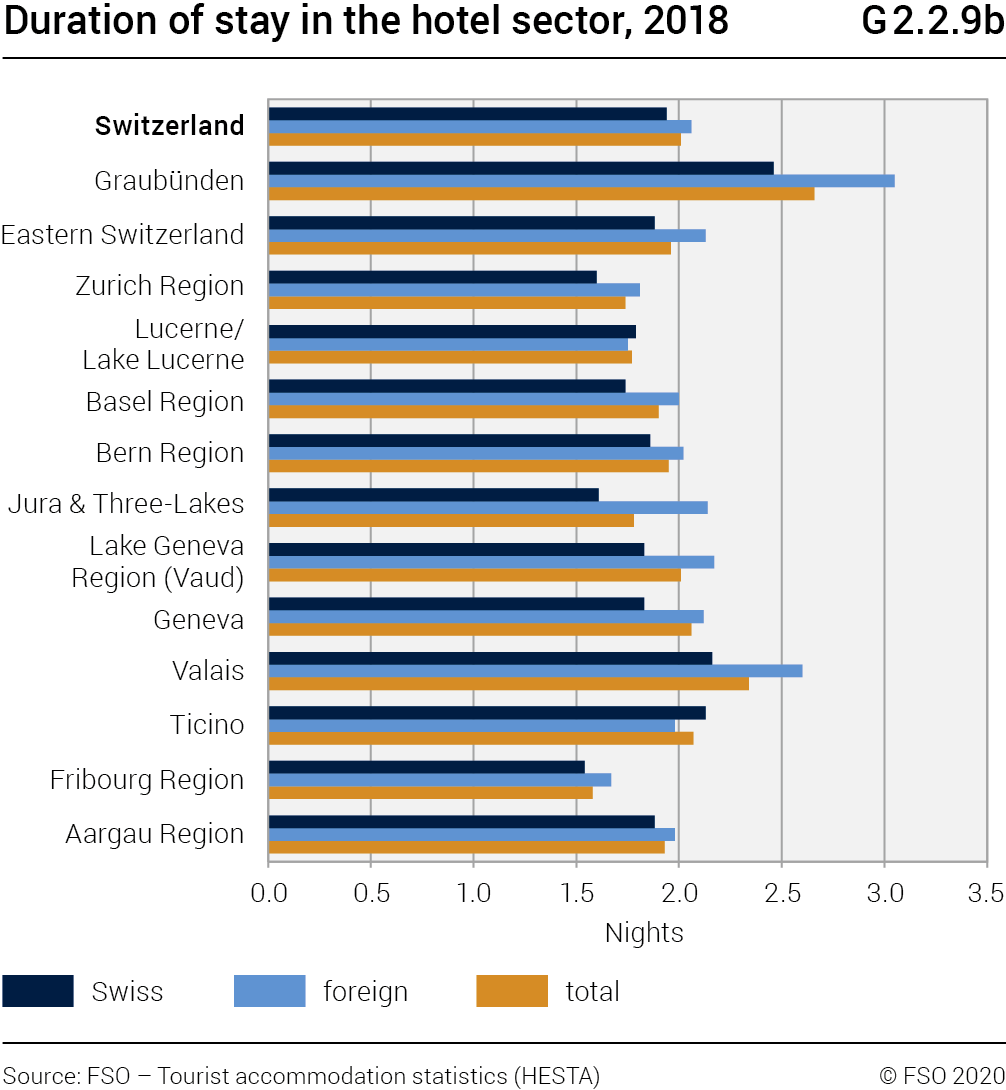
Among the tourist regions, Graubünden recorded the longest stay in 2018 with 2.66 nights (G2.2.9b). In contrast, the shortest length of stay was observed in the region of Fribourg (1.58 nights). At national level, too, the length of stay was longer for foreign clientele than for domestic visitors in the majority of tourist regions. The greatest difference was observed in Graubünden where foreign visitors stayed for an average of 3.05 nights whereas Swiss visitors stayed for 2.46 nights.
Did you know?
In 2018, the length of stay by Swiss visitors was greater than that of foreign visitors in only two tourist regions, namely Ticino and the Lucerne/Lake Lucerne Region.
2.2.10 Occupancy rate of rooms
In 2018, the net room occupancy rate in hotels and health establishments was 54.5% (52.9% in 2017) nationally (G2.2.10). This was the highest rate in the last five years. This rate varied considerably depending on the tourist region. The highest rate for 2018 was recorded in Geneva with 67.2%. The region of Eastern Switzerland registered the lowest rate with 41.4%. Compared with 2017 and with the exception of Ticino, almost all tourist regions saw a rise in their net room occupancy rates. The greatest increases between the two years were observed in Valais (2017: 49.0%; 2018: 52.2%).

2.2.11 Change in demand in the countries
neighbouring Switzerland
In the EU28 in 2018, overnight stays in the hotel sector increased by 2.4% (G2.2.11). An increase was also seen in Switzerland (+3.8%) and in the countries neighbouring Switzerland.
Overnight stays by residents (+2.2%) and non-residents (+2.7%) increased in the EU28 and in the countries neighbouring Switzerland with the exception of France where there was a decrease in overnight stays by residents (–0.4%). In Switzerland, overnight stays by residents showed an increase of 2.9% and overnight stays by non-residents an increase of 4.5%.

2.3 Supplementary accommodation results
In the supplementary accommodation sector, the statistic covers three main types of accommodation: commercially-run holiday homes, collective accommodation and campsites. In order to present information from the supplementary accommodation sector as comprehensively as possible, the results are broken down by each type of accommodation.
2.3.1 Supply in supplementary accommodation
A) Holiday homes
In 2018, a total of 31 477 commercially run holiday homes were counted in Switzerland (G2.3.1a). In terms of beds, this represented a capacity of 154 149 units. If we consider the distribution of holiday homes by Switzerland’s seven major regions, the Lake Geneva Region has the largest share with 46.5% of the total. This was followed by Eastern Switzerland with a share of 27.8%.
B) Collective accommodation
At national level, there were 2444 collective accommodation units, i.e. a total of 115 680 beds were surveyed for the year 2018 (G2.3.1b). At major region level, Espace Mittelland had the greatest share of establishments (26.9%) closely followed by Eastern Switzerland (25.3%) and the Lake Geneva region (24.7%).
C) Campsites
The total number of campsites surveyed in Switzerland in 2018 was 401, i.e. 30 011 rental pitches for passing guests (G2.3.1c). In terms of distribution at major region level, Espace Mittelland (27.4%) and the Lake Geneva region (25.7%) recorded the largest number of establishments.


2.3.2 Demand in supplementary accommodation
A) Holiday homes
In 2018, overnight stays registered in holiday homes reached a total of 7.5 million nationally, i.e. an increase of 2.9% compared with 2017 (G2.3.2.1a). Swiss guests generated 4.4 million overnight stays (–1.1%). Foreign clientele accounted for 3.2 million units (+8.9%) of which more than 80% came from European visitors. At major region level, the Lake Geneva Region counted the greatest number of overnight stays in 2018 with a total of 3.2 million units (G2.3.2.2a).


B) Collective accommodation
Demand for collective accommodation corresponded to 5.4 million overnight stays for 2018, an increase of 0.8% compared with the previous year (G2.3.2.1b). Swiss visitors accounted for the largest share of overnight stays with 4.4 million units (+2.3%). Demand from foreign visitors reached 1.1 million overnight stays (–5.1%). European visitors generated almost three quarters of these stays (73.5%). Espace Mittelland and the Lake Geneva Region (G2.3.2.2b) are the major regions with the most overnight stays (1.5 million and 1.4 million units)
Did you know?
Espace Mittelland, the Lake Geneva Region and Eastern Switzerland alone generated 77.1% of overnight stays from collective accommodation in Switzerland.


C) Campsites
For 2018, campsites in Switzerland counted a total of 3.6 million overnight stays, which represents an increase of 12.8% compared with 2017 (G2.3.2.1c). 2.4 million overnight stays could be attributed to Swiss clientele (+12.8%) and 1.2 million to foreign visitors (+14.4%). It should be noted that 96.7% of these foreign visitors came from Europe. The Lake Geneva Region recorded the greatest number of overnight stays with 907 000 units. It was followed by Ticino with 770 000 units (G2.3.2.2c).


2.3.3 Breakdown for monthly demand
A) Holiday homes
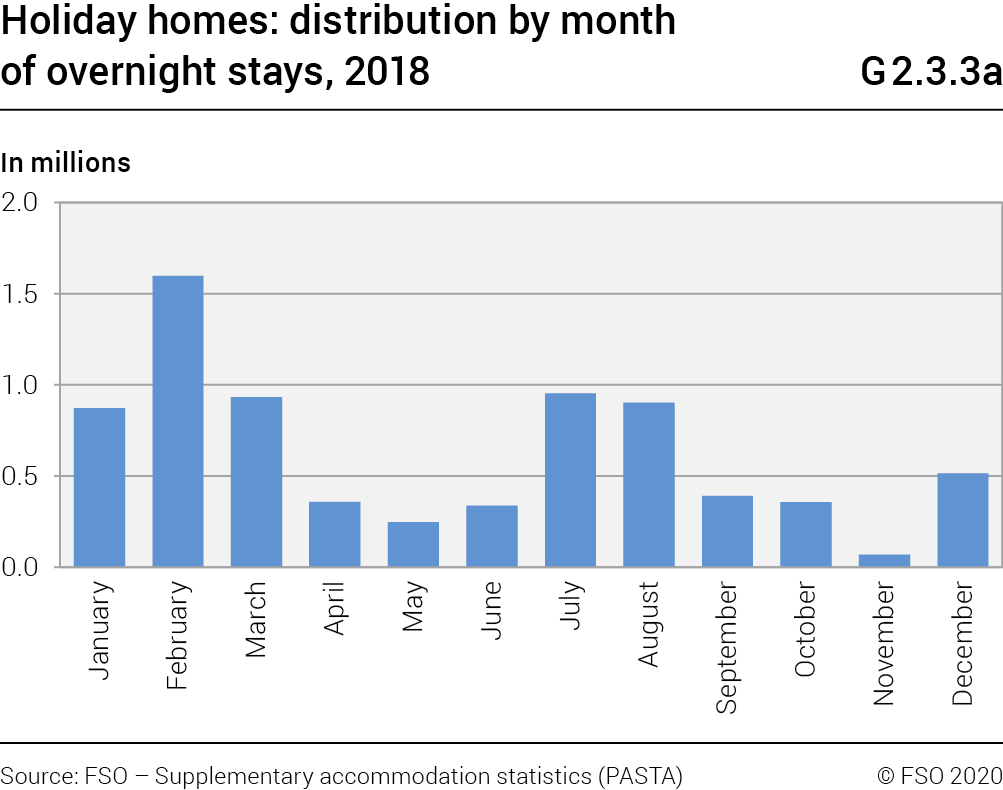
Overnight stays in holiday homes were mainly concentrated at the start of the year (G2.3.3a). The period from January to April represented half of the total number of overnight stays (49.9%) generated in 2018. The months of July and August were also an important period in terms of overnight stays accounting for a quarter (24.6%) of overnight stays registered.
Did you know?
In holiday homes, February alone accounted for 21.2% of the annual number of overnight stays in 2018.
B) Collective accommodation
The monthly breakdown of demand in collective accommodation in 2018 highlighted the fact that overnight stays were mainly generated in summer, more precisely between June and September (G2.3.3b). The share from these four summer months represented 47.1% of the annual overnight stays with a peak in July and August (28.6% of the 2018 total for both of these months accumulated). The period from January to April also showed a number of overnight stays that was consistent with a share of over one third (33.6%) of the annual demand.
C) Campsites
Showing strong seasonal variation, demand in campsites was unsurprisingly almost entirely concentrated over the summer period (G2.3.3c). Two thirds of overnight stays (66.6%) were recorded between June and August.


2.3.4 Duration of stay in supplementary
accommodation
A) Holiday homes
The average length of stay in holiday homes in Switzerland reached 6.57 nights in 2018 (6.76 in 2017) (G2.3.4a). However, this value varied by major region. Indeed, in Eastern Switzerland it was 7.03 nights (7.37) and in the Lake Geneva region it was 6.69 nights (6.79), i.e. the longest durations at this regional level. In contrast, the Zurich Region registered the shortest value of 4.57 nights (5.68).
B) Collective accommodation
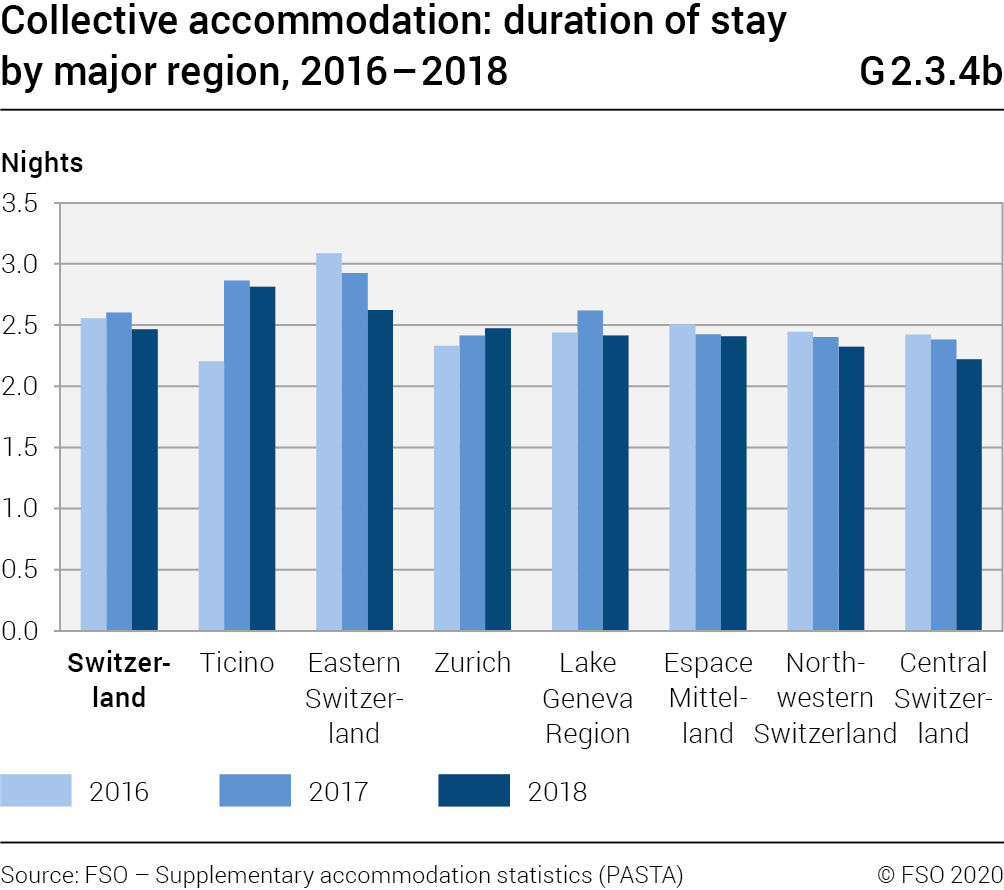
In 2018, the average length of stay in collective accommodation nationally was 2.47 nights (2.60 in 2017) (G2.3.4b). Among the major regions, Ticino registered the longest stay with 2.82 nights (2.87). This was followed by Eastern Switzerland with 2.93 nights (2.87).
C) Campsites
For campsites, the average length of stay in 2018 was 2.89 nights (2.92 in 2017) for Swiss territory (G2.3.4c). This duration reached 3.87 nights (3.73) in Ticino, i.e. the highest among all the major regions. This was then followed by the Lake Geneva region with 3.35 nights (3.14).


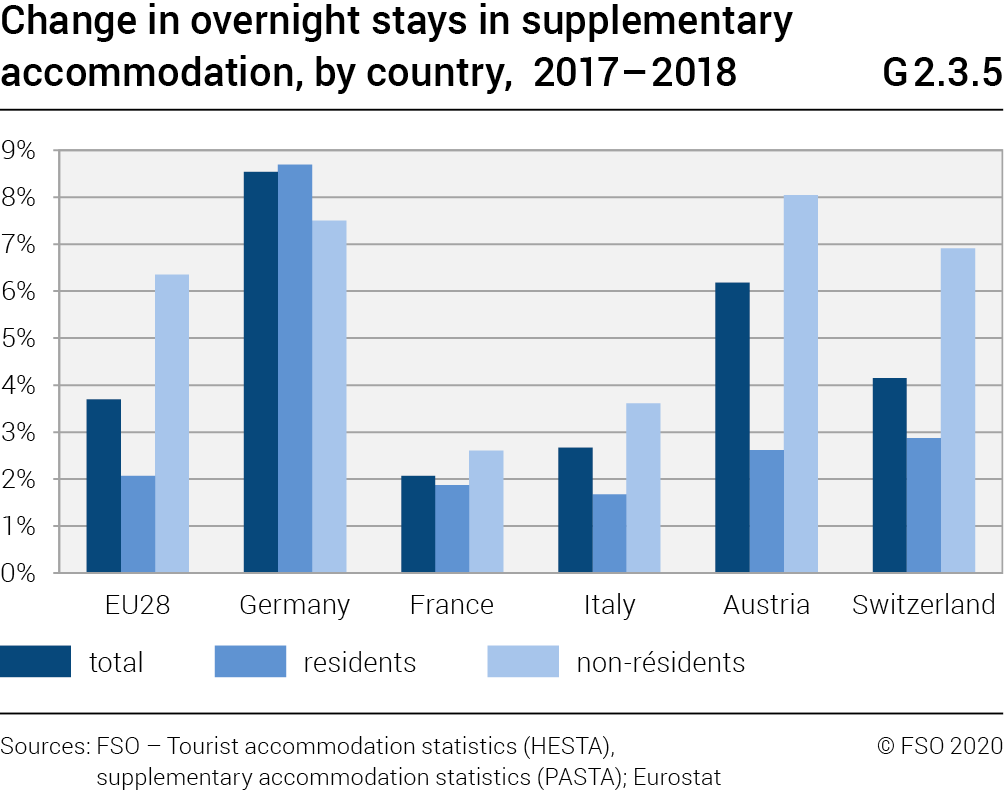
2.3.5 Change in demand in the countries neighbouring Switzerland
The increase in overnight stays in the EU28 in the supplementary accommodation sector rose by 3.7% (G2.3.5). Switzerland recorded an increase of 4.2%, i.e. an increase less significant than that of Germany (+8.5%) and Austria (+6.2%).
Overnight stays by residents of the EU28 increased by 2.1% while those by non-residents increased by 6.3%. For both Switzerland and its neighbouring countries, demand from both residents (+2.9%) and non-residents (+6.9%) showed considerable increases.