

Cause of death statistics
Death and its main causes in Switzerland, 2016
In 2016, 64 964 people died in Switzerland, 2600 or 3.9% less than in the previous year. The reason for this was high mortality rates due to the flu epidemic and heatwave the previous year. Despite the ageing of the population which normally leads to an increase in deaths, there were fewer deaths than in 2015. Life expectancy at birth in 2016 was 81.5 years for men and 85.3 years for women.
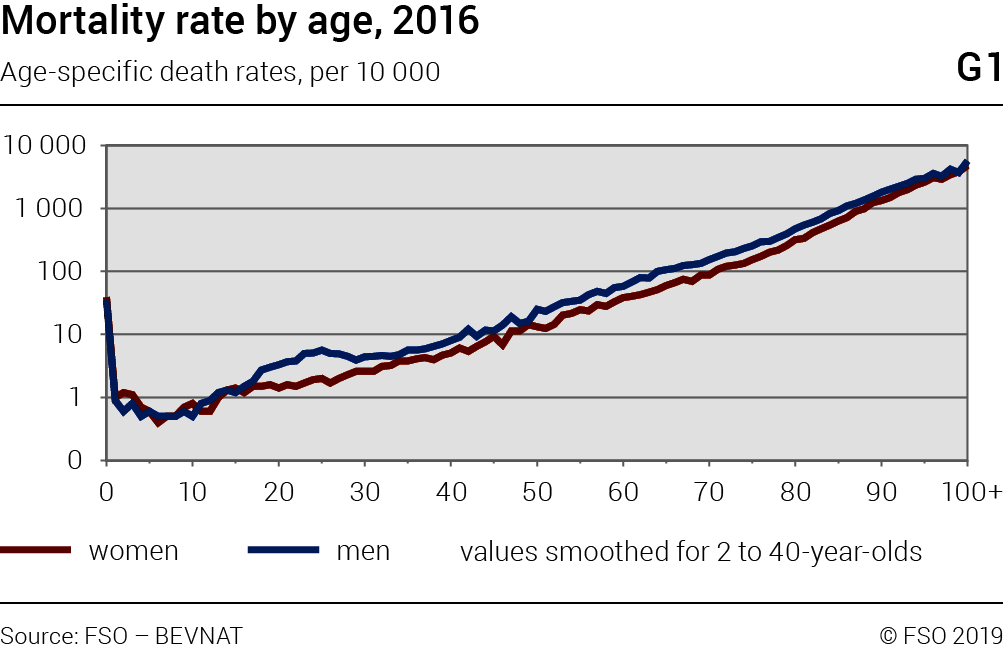
Today the majority of people are aged over 80 when they die. The probability of dying at a young age is very small. The infant mortality rate is 36 deaths per 10 000 live births. Fewer than 1 in 12 000 children aged between 1 and 16 died in 2016. The death rate shows exponential growth with increasing age and can only be demonstrated on a logarithmic scale (Graph G1). From the age of 15 onward, males are more likely to die than females. Between the ages of 19 and 27, almost three times as many men die as women.
Graph G2 shows the distribution of deaths by age and sex. Less than 1% of deceased persons were aged up to 24 years, 1.8% 25 to 44 years, 11% 45 to 64 years, 42% 65 to 84 years and 44% over 85 years.
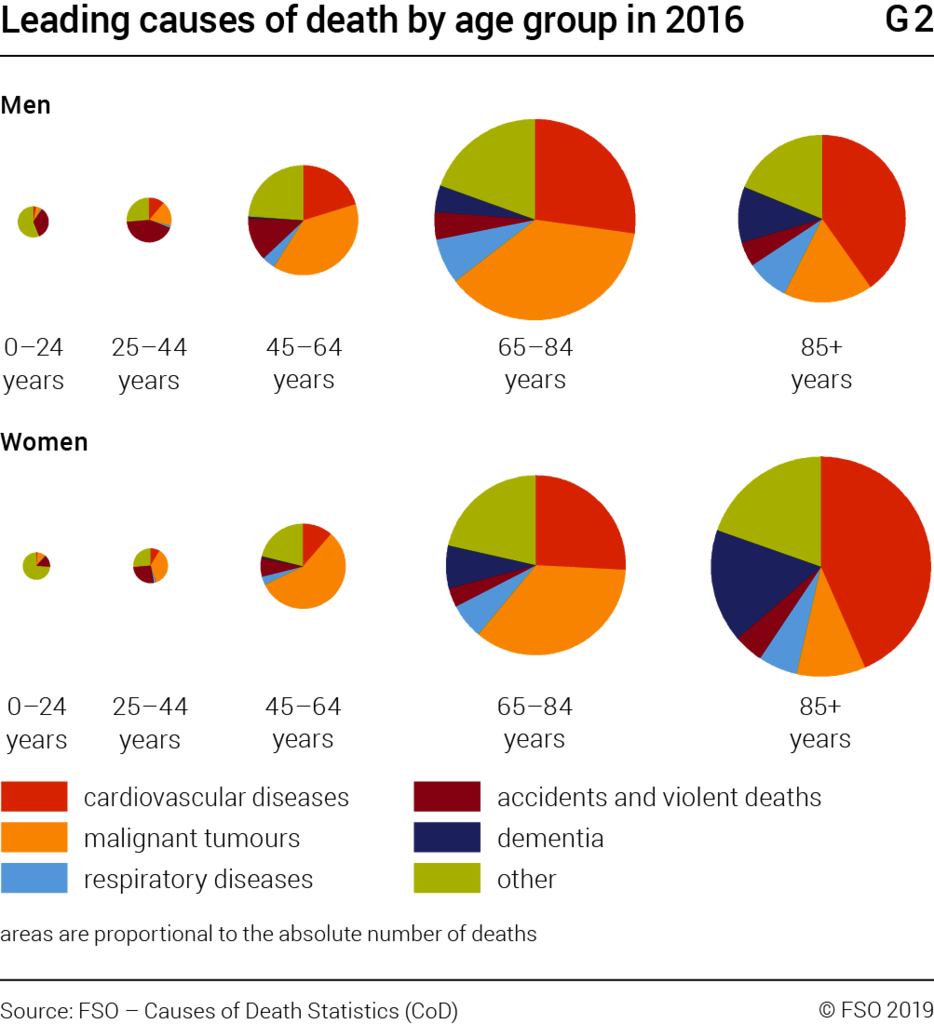
Because disease is less common or can be more effectively treated in young people, more people are dying at an older age and from diseases that are typical for this age group. Overall, deaths caused by cardiovascular disease are most common. This statement, however, only applies to the total of deaths and to women. But it no longer applies to men; in 2016 more men died from cancer than cardiovascular disease for the first time. For people over the age of 80, cardiovascular disease is still the most common cause of death, while for men aged 40 and over and women aged 30 and over cancer is the most common cause of death ahead of cardiovascular disease. External causes, especially accidents and suicide are the main cause of death among 16 to 40 year old men and 17 to 28 year old women. Among newborns, congenital illnesses and birth-related problems cause 97% of deaths.
Multi-morbidity
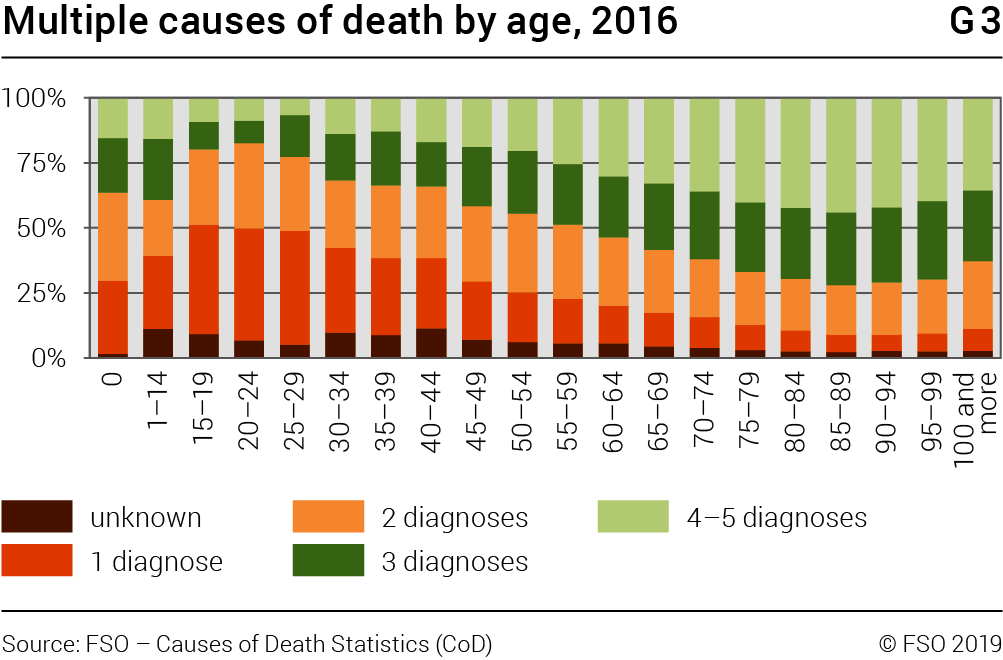
Up to four diagnoses are registered in the cause of death statistics, in exceptional cases up to five. 9.9% of deaths have one diagnosis, 22% two, 27% three and 38% four. In 3.3% of deaths, the diagnosis is unknown. The number of diagnoses increases with age (Graph G3). The greatest number of diagnoses are registered for 80 to 94 year-olds.
Even if two or more diseases have contributed to a death, only the main diagnosis appears in the usual statistical evaluations. In 2016, 68 433 secondary diagnoses from a disease group other than the main diagnosis were reported. Several diagnoses from the same disease group, e.g. heart attack and high blood pressure, are only considered once.
The most frequent causes of death are cardiovascular diseases, from which 21 000 people died. Cardiovascular disease also contributed to the death of a further 18 000 persons who died from another main cause of death. The main diagnoses are, therefore, responsible for 53% of deaths.
Main and secondary diagnoses, 2016T1
| Number of main diagnoses | Number of secon dary diagnoses | % as main diagnoses | |
|---|---|---|---|
| Cardiovascular diseases | 20 712 | 18 373 | 53.0 |
| Cancer | 17 201 | 1 737 | 90.8 |
| Respiratory diseases | 4 108 | 11 450 | 26.4 |
| other causes | 3 715 | 2 221 | 62.6 |
| Dementia | 5 764 | 4 445 | 56.5 |
| all other diagnoses | 13 464 | 30 217 | 30.8 |
Source: FSO – Causes of Death Statistics (CoD)
© FSO 2019
Cancer, on the other hand, appears 17 000 times as main cause of death, accounting for 91% of cancer cases. In contrast, diseases of the respiratory organs are the main cause of only 26% of deaths. The reason for this is that persons who are weakened by a serious illness often fall ill with pneumonia from which they die. Pneumonia accounts for a high percentage of respiratory diseases. Of the 10 200 people who died overall that were registered as having dementia, in 56% this was the main diagnosis and in 44% the secondary diagnosis.
Does dementia cause death?
In the cause of death statistics, the main cause of death is the illness which appeared when the person first became ill. The causal chain is the decisive factor. In the case of dementia, the progressive loss of brain function often results in the failure of the respiratory centre or control of the swallowing process, which may lead to terminal pneumonia. But there are also many other subsequent illnesses associated with the general breakdown of the central vital functions.
The mortality rate for the year 2016
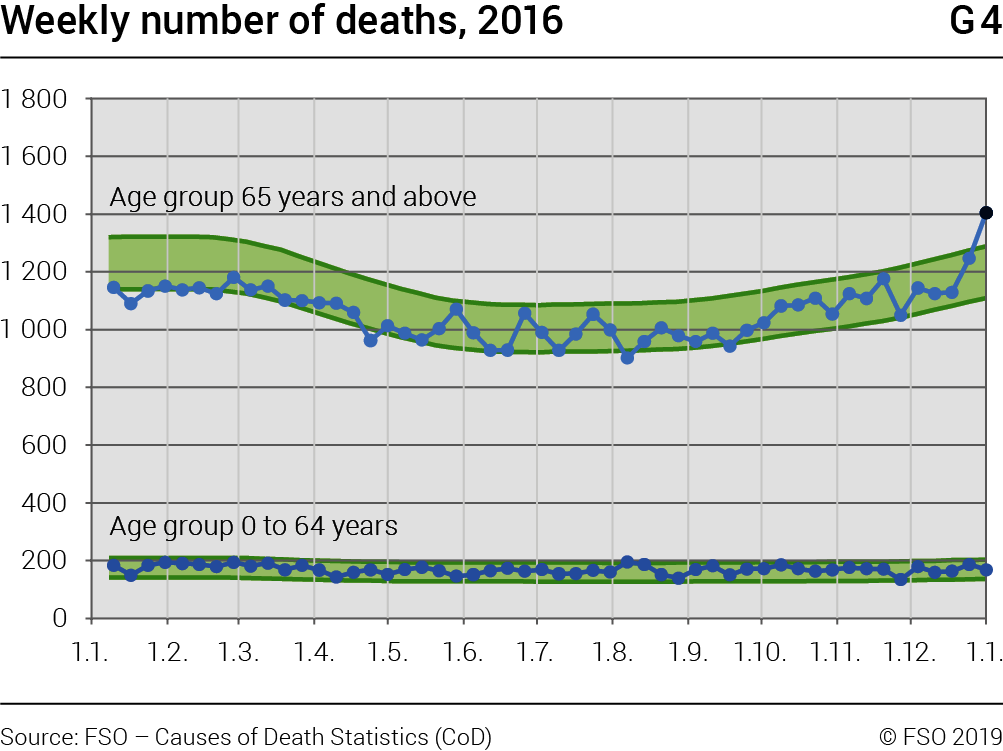
The number of cases of death is subject to considerable seasonal fluctuation. If the almost 65 000 deaths were evenly distributed over the months of the year, there would be some 5400 deaths per month. In reality more people die in the winter half-year, with a maximum of 6000 deaths in January. In the summer months (June to September) markedly fewer people die with 5000 deaths. This normal seasonal fluctuation concerns almost exclusively persons aged over 65 years.
The model used continuously to examine whether there is excess mortality relies on data from the past ten years and takes into consideration the ageing of the population, which is expected to lead to 500 more deaths per year. Only persons who have died in and were resident in Switzerland are included in the data, i.e. the 600 people with residency in Switzerland who die abroad each year, are not counted.
In 2016, there were 65 000 deaths, 2000 fewer than would have been expected according to the trend of the past ten years. This was due to the flu epidemic in the spring and the heatwave in the July of the previous year. This led to a substantially lower number of deaths in the first semester of 2016 (G4). It was only in the last two weeks of the year that the 2016/2017 winter flu epidemic had an impact.
Number of deaths: trends and forecast
Since the 1980s, approximately 60 000 persons have died annually in Switzerland. The last time the number of deaths was below 60 000 was in 1987. Over the subsequent 20 years, the number of deaths was around 62 000 (G5). Due to the high proportion of women among elderly people, since 1995 more women have died than men.
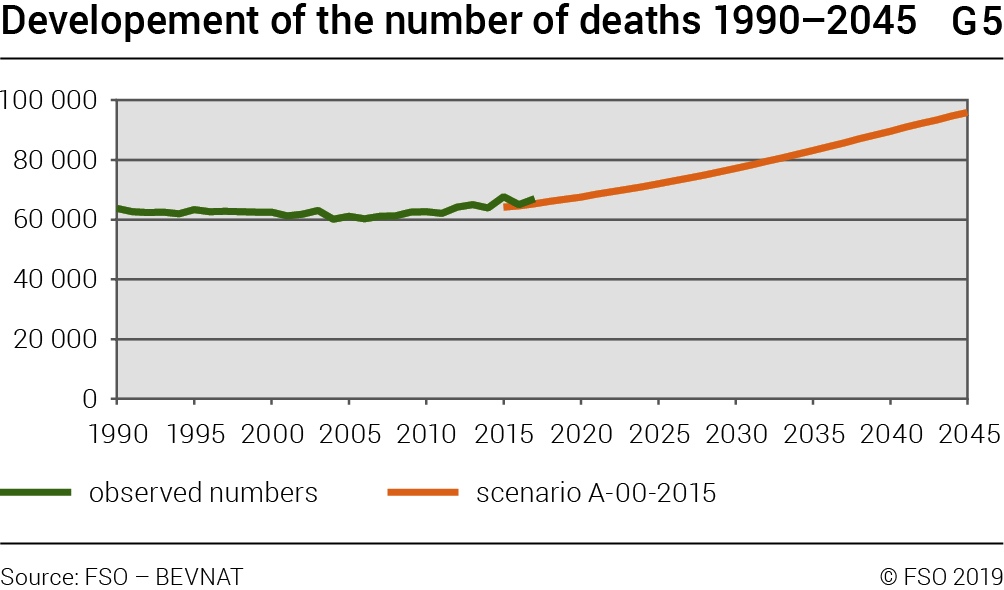
The FSO’s population development scenarios for 2015–2045 show that the number of deaths will rise over the next few years and decades (Graph G5). This is mainly due to the demographic development, the increase in the proportion of older people in our country.
Trends in the mortality rate
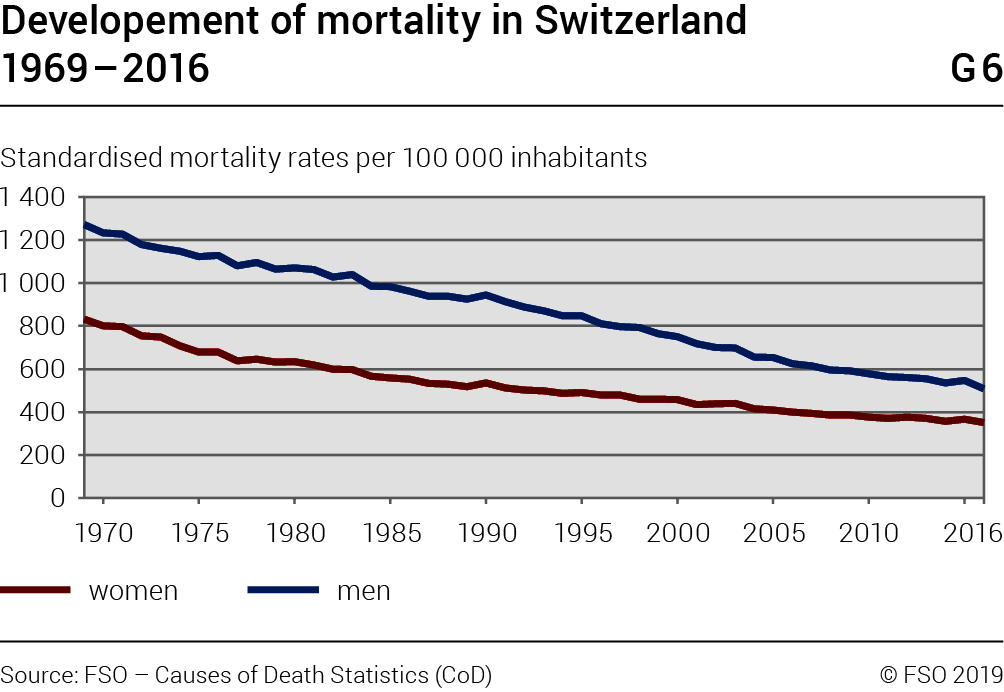
The standardised mortality rate merges the age-specific mortality rates into one figure. The time series shows the considerable decrease over the last few decades (Graph G6). The mortality rate among women decreased faster than the mortality rate among men until 1977. Since then, the drop has been relatively slower and rates among men and women have further converged. From 2015 to 2016, there was an exceptionally strong decline in mortality rates of both men (–7.2%) and women (–4.3%).
Trends in potential years of life lost
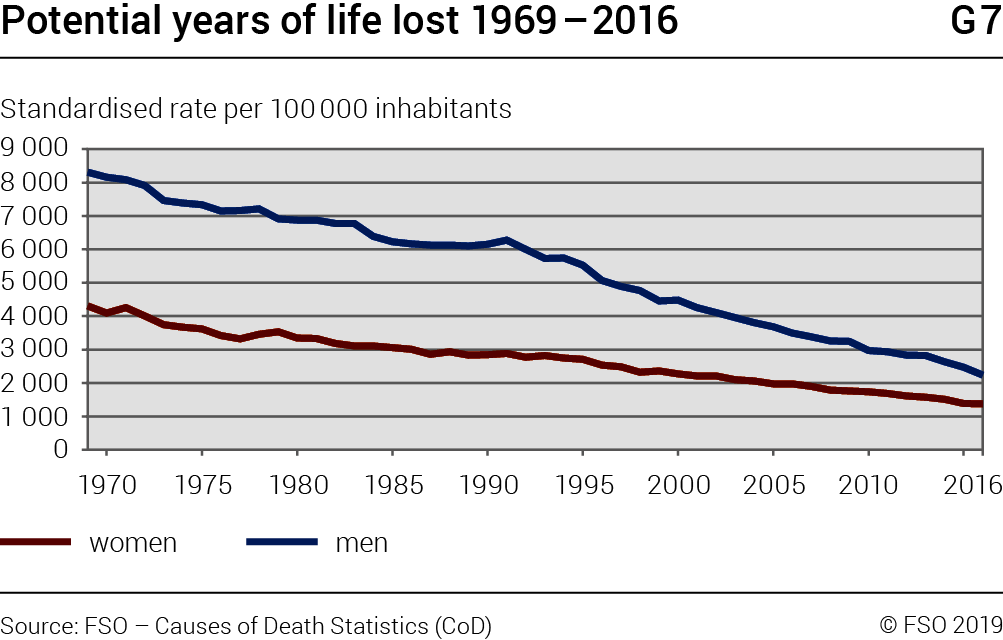
“Early” mortality is measured by the number of years of potential life lost (YPLL). In 2016, men lost 98 900 potential years (–7.5%) and women 59 700 (+0.3%) compared with 2015.
Definition
The years of potential life lost (YPLL) is an indicator used to calculate premature mortality. In order to calculate the YPLL, the total number of deaths in each age group is weighted according to the number of years of life left until the upper age reference of 70. If death occurs at the age of 5 years, for example, the number of YPLL is 65. The upper age reference is commonly set at 70 for reasons of comparability (used e.g. by the OECD).
The standardised rate of the YPLL per 100 000 inhabitants among women is less than a third and among men over a quarter of its size in 1969 (G7). In the second half of the 1980s, for men this development temporarily came to a halt following the Aids epidemic, since then, however, it has progressed far more quickly than for men that it has for women. From 2015 to 2016, the YPLL rates decreased further.
Cause of death indicators
Causes of death can be illustrated by using various indicators to show different aspects. Table 2 shows eight indicators. The simplest are the absolute number and the percentage of all deaths. These numbers can be directly compared with one another and show very simply which causes of death are common and which are rare. The crude rate puts the number of deaths in relation to the number of inhabitants but does not take the age distribution of the population into account. Standardised rates do take this into account and can therefore be used to compare mortality between different points in time and among different regions. The years of potential life lost (YPLL) are an indicator for premature mortality. They show where prevention can play a particularly important role.
Indicators for the main causes of death, 2016T2
| Number | % of all deaths | Crude rate1 | Standardised rate2 | PYLL abs.3 | % of PYLL | PYLL stand. rate4 | Average age at death (years) | |
|---|---|---|---|---|---|---|---|---|
| Men | ||||||||
| all causes of death | 31 283 | 100.0 | 754.3 | 508.0 | 98 851 | 100.0 | 2 234.0 | 76.2 |
| Cardiovascular diseases | 9 357 | 29.9 | 225.6 | 144.3 | 15 890 | 16.1 | 342.8 | 80.4 |
| Cancer | 9 371 | 30.0 | 225.9 | 155.6 | 29 180 | 29.5 | 630.0 | 73.8 |
| Respiratory diseases | 2 183 | 7.0 | 52.6 | 33.4 | 2 837 | 2.9 | 62.1 | 80.3 |
| External causes | 2 173 | 6.9 | 52.4 | 40.6 | 26 028 | 26.3 | 630.3 | 64.3 |
| Dementia | 1 789 | 5.7 | 43.1 | 25.6 | 185 | 0.2 | 3.8 | 85.9 |
| all other diagnoses | 6 410 | 20.5 | 154.6 | 108.5 | 24 731 | 25.0 | 564.9 | 73.4 |
| Women | ||||||||
| all causes of death | 33 681 | 100.0 | 797.0 | 351.5 | 59 672 | 100.0 | 1 376.0 | 81.8 |
| Cardiovascular diseases | 11 355 | 33.7 | 268.7 | 98.1 | 5 548 | 9.3 | 119.8 | 86.6 |
| Cancer | 7 830 | 23.2 | 185.3 | 105.8 | 28 195 | 47.3 | 623.6 | 74.0 |
| Respiratory diseases | 1 925 | 5.7 | 45.6 | 18.9 | 1 670 | 2.8 | 37.6 | 83.6 |
| External causes | 1 542 | 4.6 | 36.5 | 18.6 | 9 057 | 15.2 | 225.9 | 76.8 |
| Dementia | 3 975 | 11.8 | 94.1 | 31.5 | 278 | 0.5 | 5.6 | 88.3 |
| all other diagnoses | 7 054 | 20.9 | 166.9 | 78.6 | 14 924 | 25.0 | 364.0 | 79.6 |
1 Rude rate: Number of deaths per 100 000 inhabitants
2 Standardised rate: direct age-standardisation with European standard population 1980
3 PYLL: Potential years of life lost of persons dying before age 70
4 PYLL standardised rate: YPLL per 100 000 inhabitants, age-standardised
Source: FSO – Causes of Death Statistics (CoD)
© FSO 2019
The average age at death is a clear way of showing that different health problems occur at different phases of life. Among men, the widest gap can be seen between external causes (especially accidents and suicide) and dementia. On average men die from dementia aged 86, whereas accidental deaths or suicide occur when they are 22 years younger. Therefore, only 0.2% of years of potential life are lost to dementia, but 26.3% to external causes.
Among women the widest gap is between dementia and cancer. Their average age at death from dementia is 88 and from cancer 74. They lose 0.5% of potential years of life to dementia but 47% to cancer. The age at which men and women die from accidents differs greatly, as frequent falls among women in old age often prove fatal.
Data source and methods
The Swiss Cause of Death Statistics were introduced in 1876. They are based on the medical certificate of cause of death. Diagnoses are recorded in words, the coding is based on the ICD-10 and is conducted in the Federal Statistical Office according to the rules defined by the WHO. All collected data are treated anonymously and strictly confidentially and are subject to the provisions of the Federal Data Protection Act of 19 June 1992 (SR 235.1). Publications on the cause of death statistics relate to persons who were resident in Switzerland, i.e. who were part of the permanent resident population independent of their nationality and place of death.
Missing data
For 3.3% of deaths in 2016 the cause of death is unknown. This is either because no diagnosis could be made or because this information was not communicated to the FSO. Information is incomplete for 2.5% of deaths in Switzerland (99%) and 92.8% of deaths abroad (1%). The percentage of unknown causes of death decreases from around the age of 45 years with increasing age.
Further information on the cause of death statistics on the internet: www.statistik.ch → Look for statistics → Health → State of health → Mortality, causes of death