4.1 Gross value added by tourism
At 5.9%, the growth in gross value added by tourism between 2014 and 2017 was extremely high. Gross value added by tourism is composed of the two product categories tourism-specific and non-tourism specific products. Tourism-specific products account for 97.5% of the total gross value added by tourism. The value added generated by tourism-related products is also posted in the category "tourism-specific products". The share of value added in the total economy's value added that is generated by tourism-related products remained practically constant between 2014 and 2017 at 20%. Non-tourism specific products created around 2% of gross value added by tourism. This figure was 2.5% in 2014 and 2.4% between 2015 and 2017. It is worth noting that the latter products' shares of value added by tourism have remained more or less stable over the past four years.
Although a negative effect (–1.9%) was seen in the gross value added by tourism from accommodation in 2015, in 2016 a stabilisation was observed (0%) prior to a sharp rise (+2.8%) in 2017. The opposite trend was observed in food and beverage services and hotels: at the start of the period in 2015, a distinct rise of +7.6% was recorded and the following years showed a decline in growth in 2016 (+2.9%) and in 2017 (+0.5%). At the same time gross value added by tourism from passenger transport services initially showed a slight decline (–1.2%) before recording a positive trend in 2016 (+2.2%) and in 2017 (+5.0%).
At 5.9%, the growth in all gross value added by tourism between 2014 and 2017 was very high. Although the somewhat negative trends of certain individual products have led to a slowing of overall growth in certain individual years, the overall trend remains positive (2015 +0.9%; 2016 +2.6; 2017 +2.2%).

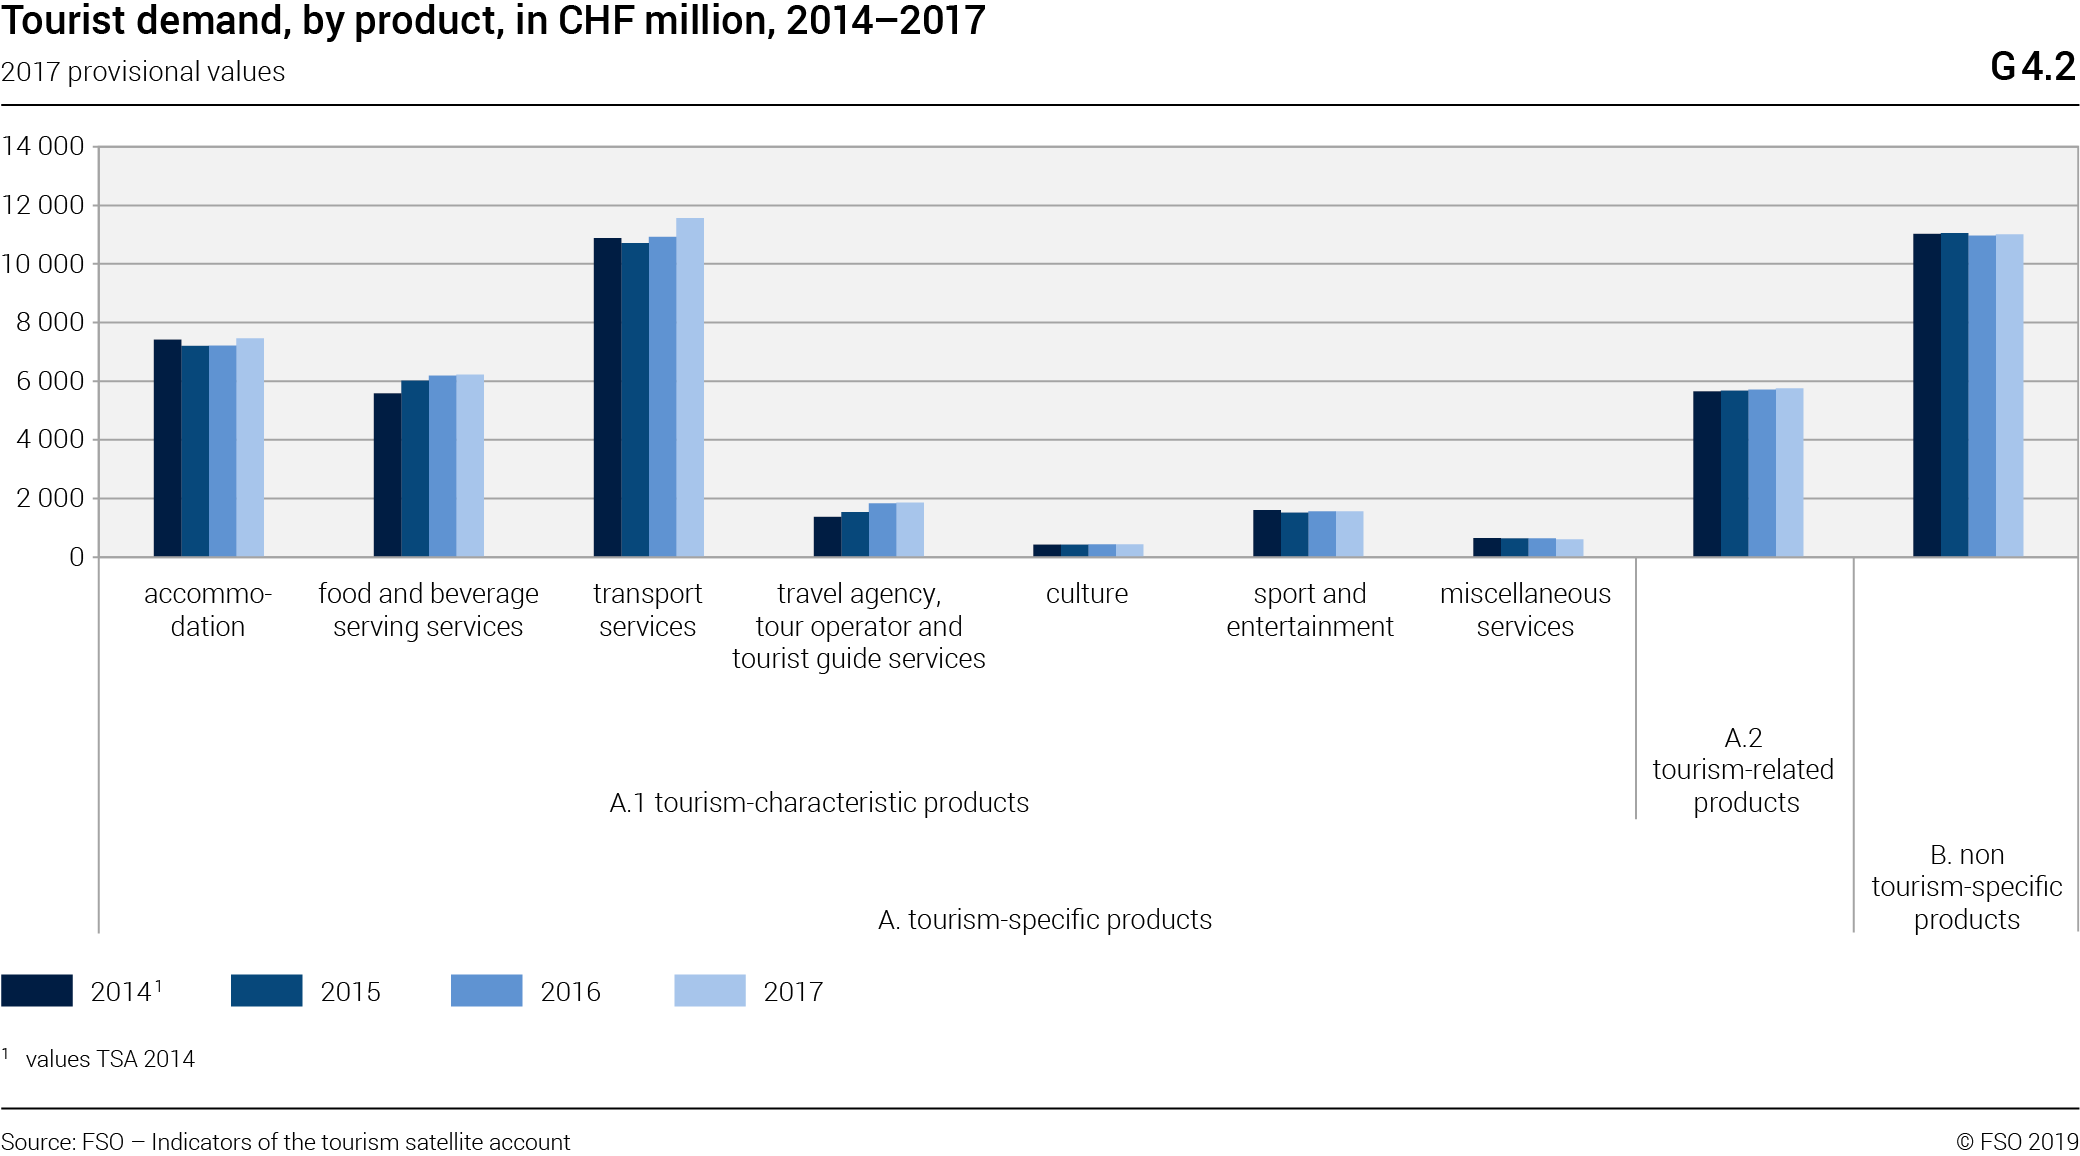
4.2 Tourism demand
Tourism demand is the total expenditure on products or services consumed by tourists. This includes both expenditure by tourists as well as that by third parties on behalf of tourists.
The indicators of the last four years show that on average, 65% of tourism demand consisted of tourism characteristic products. Accordingly, tourism characteristic products carry a large weight in the total tourism demand. In the observation period 2014 to 2017, demand for tourism characteristic products saw a moderate increase (+2.4%). Overall tourism demand initially underwent a slight decline in 2015 (–0.8%), but thanks to slight growth in 2016 and 2017 of 1.1% and 2.1%, the period as a whole saw growth of 2.4%.
The products "Accommodation", "Food and beverage serving services" and "Transport services" jointly accounted for over 55% of the tourism sector's total demand. Within the tourism-characteristic products, over 85% of the value added were accounted for by these three products between 2014 and 2017.
Although tourism demand for accommodation declined in 2015 (–2.9%), this trend was compensated for by a slight increase of 0.2% in 2016 prior to much stronger growth in 2017 (+3.3%). This resulted in average growth of +0.6% between 2014 and 2017. Following a sharp rise in 2015 (+7.7%), demand for food and beverage services slowed in 2016 (+2.9%) and in 2017 just managed a positive result with a narrow margin of +0.5%. In the period under observation, overall growth saw a clear increase of +11.4%. Transport services initially saw a decline (–1.6%) in 2015, followed by growth in 2016 (+2.0%) and even stronger growth in 2017 (+5.8%). This growth led to an overall increase of 6.2% between 2014 and 2017.
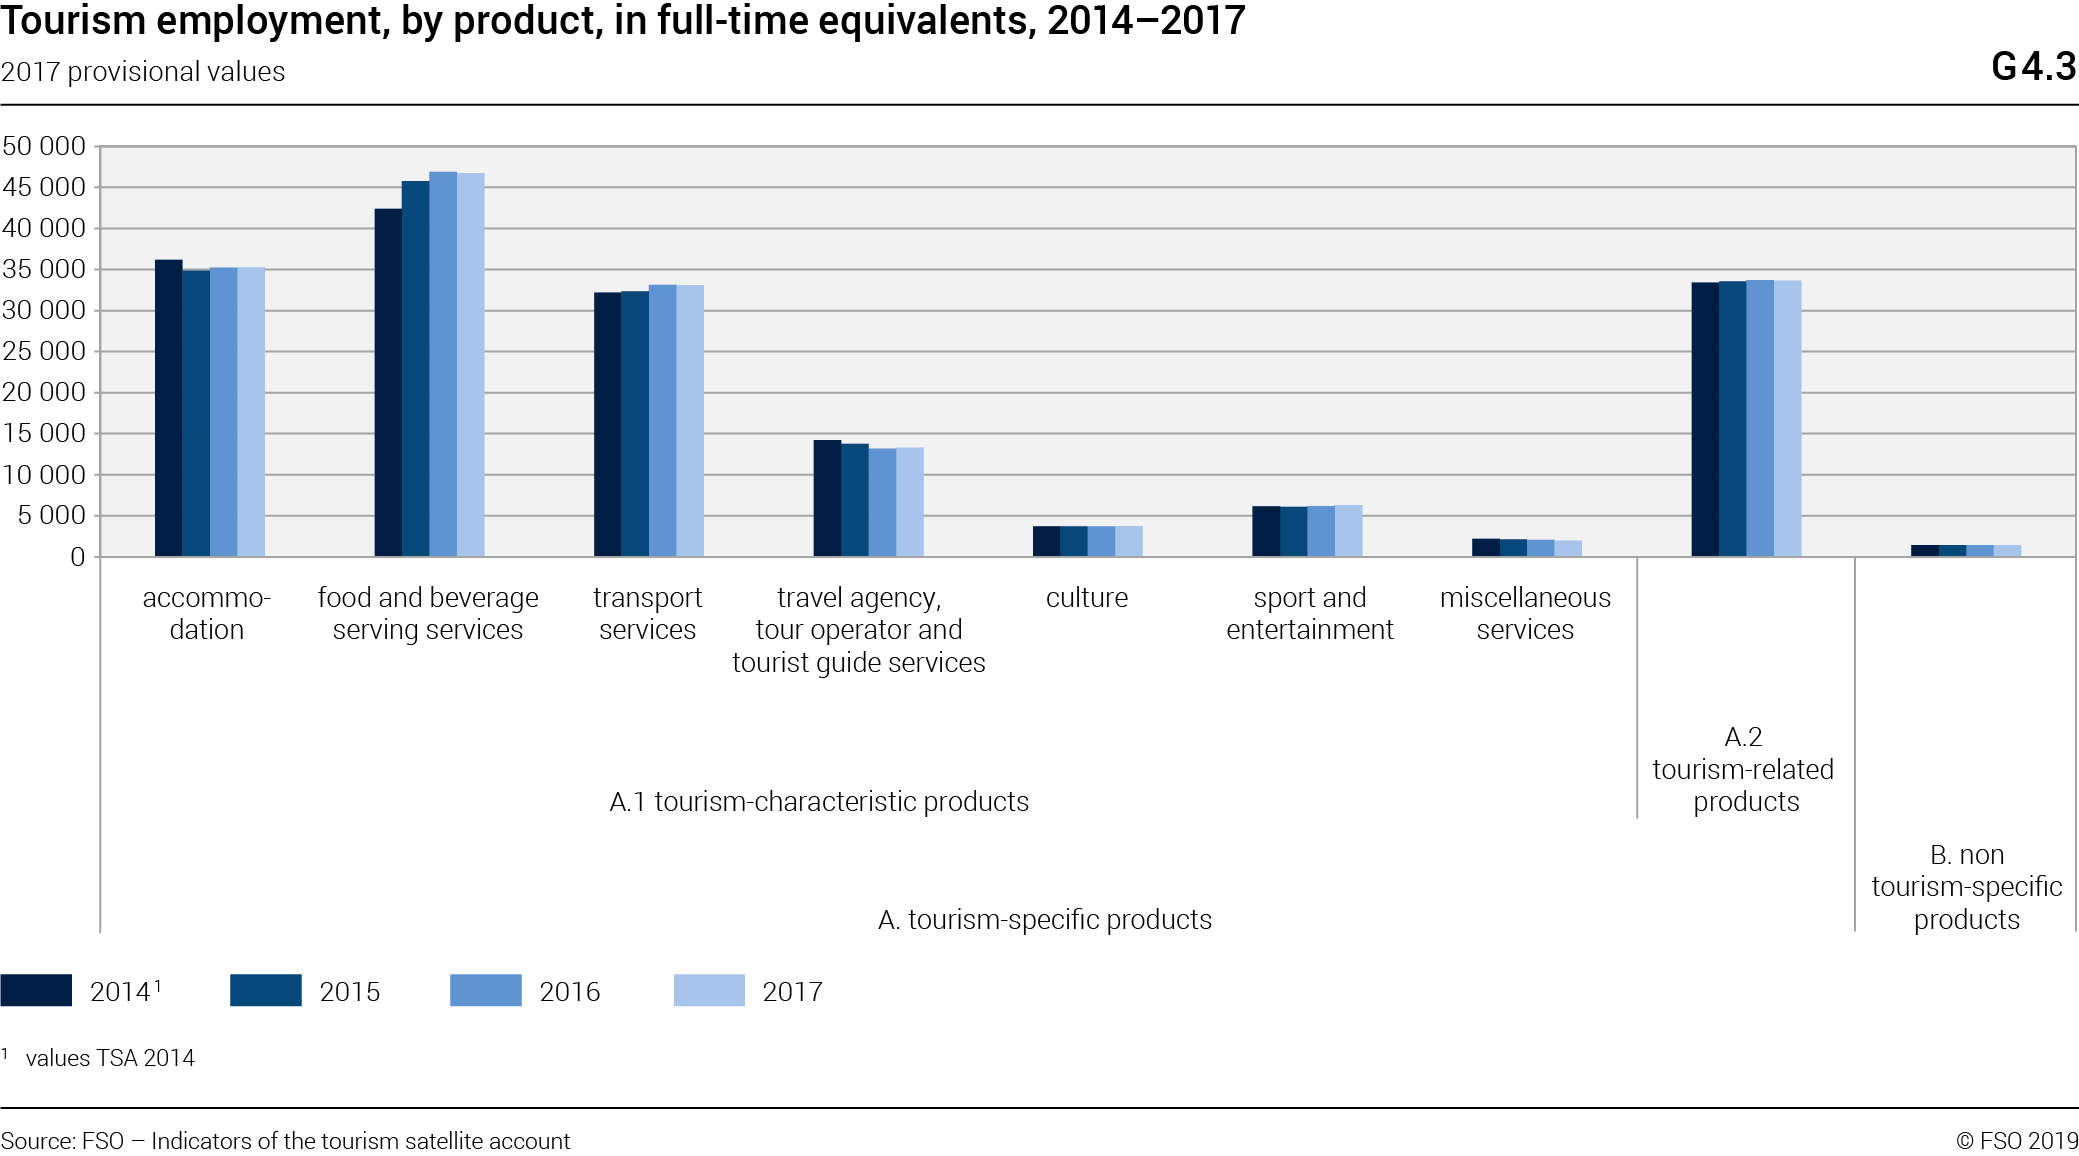
4.3 Tourism employment
The total volume of tourism employment in 2017 corresponded to 175 489 full-time equivalents. This corresponds to a share of 4.4% in employment in the economy as a whole. While tourism employment rose in 2015 (+1.0%) and continued to do so in 2016 (+1.1%), in 2017 it slowed once again (0%). Tourism employment over the whole period 2014 to 2017 rose by 2.2%.
Because accommodation and food and beverage serving services are labour intensive products, they are particularly important to employment in tourism.
Employment in accommodation declined sharply in 2015 (–3.7%) but in 2016 rose again slightly (+1.0%). 2017 saw a weak increase of +0.2%, resulting in an overall decline of –2.6% for the 2014 to 2017 period as a whole. Employment in food and beverage services saw particularly strong growth in 2015 (+8.0%) and maintained this positive trend in 2016 (+2.4%) before experiencing a slight decline in 2017 (–0.3%). Growth for the entire period between 2014 and 2017 was considerably positive (+10.3%).
Employment in transport services saw a positive trend in 2015 (+0.5%) and in 2016 (+2.5%). However, in 2017 a slight decline was observed (–0.1%). This led to an overall increase of 2.9% for the 2014–2017 period.