
Survey on diversity and coexistence in Switzerland (VeS): Results 2018
The presence of many social groups and a variety of affiliations is a feature of life in Switzerland. More than ten main religious communities are present in the country and, in addition to the four national languages, no fewer than ten other languages are widely spoken. The population of Switzerland comprises almost 200 different nationalities. Among Swiss passport holders, one person out of eight was born abroad and therefore has experience of migration.
This diversity is enriching but can also create challenges. Questions can arise on the acceptance, rejection and integration of certain groups. Against this context, the survey on diversity and coexistence in Switzerland (VeS) aims to present an accurate picture of the issues raised by the coexistence of different population groups currently living in Switzerland. The data collected are used to observe social change and to make detailed analyses: they help to guide policies on integration and anti-discrimination.
This publication presents the main results of the 2018 survey. Figures are given for six key areas informing us on questions of diversity, integration and racism. Divided into six chapters, each area refers to a concept expressing particular forms of racism.
Summary:
Overview of 2018 results
1 Racism and integration
2 Sense of discomfort
3 Sense of threat
4 Attitudes towards foreigners
5 Attitudes towards target groups
6 Experience of discrimination
Bibliography
Survey methodology
The survey forms part of the Federal Statistical Office’s Omnibus series of multiple-theme surveys and is carried out on a sample of 3000 people aged 15 to 88 who are randomly selected from a sample register. It is a mixed mode survey which means it can be answered either by completing an online questionnaire (CAWI) or by telephone interview (CATI).
Degree of regionalisation:
Switzerland and major regions NUTS 2
Periodicity:
Biennially – excluding ad-hoc modules
Annually – including ad-hoc modules
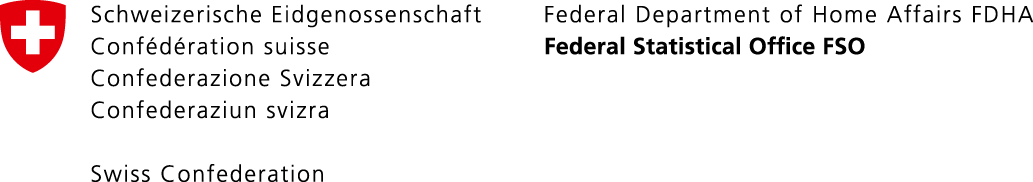
Overview of 2018 results
In 2018, 34% of the population said they felt uncomfortable in the presence of people perceived as different, due to, for example, their nationality, religion or skin colour (– 2 percentage points compared with 2016). Despite this discomfort, overall the population is open-minded with the majority in favour of granting foreign nationals more rights, especially the right to family reunification (61% in favour of granting this right in 2018, compared with 60% in 2016). 59% of the population recognise that racism is an important social issue (– 6 percentage points compared with 2016) and 55% consider that the integration of migrants in Swiss society is working well (– 1 percentage point compared with 2016). These are some of the results of the VeS survey that will be presented in detail in this publication.
1 Racism and integration
Against a backdrop of global trade, growing migratory flows and the heightened interdependence of peoples and countries, a question – and a major challenge we are facing – is how to manage human diversity National Consultative Commission on Human Rights, CNCDH France, 2016. The fight against racism, anti-Semitism and xenophobia, 2015 report. . At local level, various parties are involved in the management of this diversity. Countries’ inhabitants, different institutions and organisations, but also the political powers, can take action to contribute to a harmonious coexistence.
The figures presented below address the subject of racism as a social problem and that of the integration of migrants in Switzerland. They give us information about the population’s opinions on the effectiveness of Swiss policy on the combat against racial discrimination and on integration. They also give an indication as to who should increase or reduce their investment in the management of the diversity.
Key figures
Racism:
Recognise problem 59%
Enough being done 59%
Not enough being done 31%
Too much being done 7%
Integration:
Working well 55%
Enough being done 55%
Not enough being done 26%
Too much being done 16%
Evaluation of the process and problems
The graphic G1.1 shows that the population has quite a favourable opinion of the process of migrant integration in Switzerland, whereas racism is considered to be a serious social problem.
With regard to the integration of migrants, 55% of persons said that this is proceeding well or very well. In contrast, 43% said it was proceeding badly or very badly. 2% of persons did not give their opinion on this subject. For over a third of people (40%), the subject of racism is not judged to be serious. The majority – 59% – do, however, see a major social problem. Only 1% did not give their opinion about racism.

Assessment of steps taken
The graphic G1.2 shows an assessment of the effectiveness of the steps taken, in Switzerland, in favour of migrant integration and in combating racial discrimination. Indirectly it shows how the population assesses the functioning of Swiss policy on these issues.
With regard to migrant integration, 55% of persons said that the steps taken were in line with needs, 16% think that too much is being done and 26% not enough. Opinions were similar with regard to the combat against racism: 59% think that the steps taken are adequate, 7% that too much is done and 31% not enough.

Key players
With regard to both integration and the combat against racism, the population forms an opinion of those in charge of taking the necessary steps. The following figures focus on the opinions of persons dissatisfied with the current situation, i. e. those who think too much or, on the contrary, too little is done in these areas.
Of all the people dissatisfied with the situation in terms of migrant integration, 45% consider that measures should be taken by the State – or the Confederation, the cantons and the communes. 17% think that it is the responsibility of each individual and 12% consider that it is the responsibility of associations or NGOs. 11% mention that it is up to the foreigners themselves to make an effort towards integration.

Concerning the combat against racism, 29% of people said that steps should be taken by the Confederation, the cantons or the communes and 24% by each individual. The other parties stand out more clearly from the above: 19% consider that measures should be taken by the world of politics, 15% by schools or teachers.
For both of these issues, the State remains the agency mentioned most often by people who think that measures should be taken now in Switzerland. Individual responsibility and the role of citizens are the second factor most often mentioned. Interestingly, although politicians are considered to be key players in the fight against racial discrimination, they are considered less important for integration where the role of associations and NGOs comes to the forefront.
Ranking of key players T1
| Rank | Overall ranking | Migrant integration | Fight against racism |
|---|---|---|---|
| Top 5 | |||
| 1 | State | State | State |
| 2 | citizens | citizens | citizens |
| 3 | politics | associations | politics |
| 4 | schools | foreigners | schools |
| 5 | associations | politics | associations |
| Top 10 | |||
| 6 | foreigners | social security | media |
| 7 | economic circles | schools | legislative power |
| 8 | social security | economic circles | churches |
| 9 | legislative power | legislative power | foreigners |
| 10 | media | others | economic circles |
Source: FSO – VeS-2018, Survey on diversity and coexistence in Switzerland
FSO 2019
Summary
In 2018, the population living in Switzerland recognised that racism is an important social issue and believed that the integration of migrants is working well overall. However, measures could still be taken to improve the situation in both areas and it is primarily up to the State to take action.
2 Sense of discomfort
In a diverse society, the groups that are the focus of social issues change over time. The differences – real or imaginary – that a country’s residents conceive to define themselves can also vary depending on the situation.
The figures presented below show the characteristics of “others” which, in everyday life, are currently likely to make the population living in Switzerland feel uncomfortable. They also provide information about the situations in which these perceived differences are considered to be the most problematic.
Key figures
Total discomfort 34%
By cause – in everyday life:
Different skin colour 7%
Different nationality 7%
Different language 12%
Different religion 10%
Itinerant way of life 21%
By context:
In everyday life 19%
At work 25%
In the neighbourhood 18%
Discomfort depending on the cause
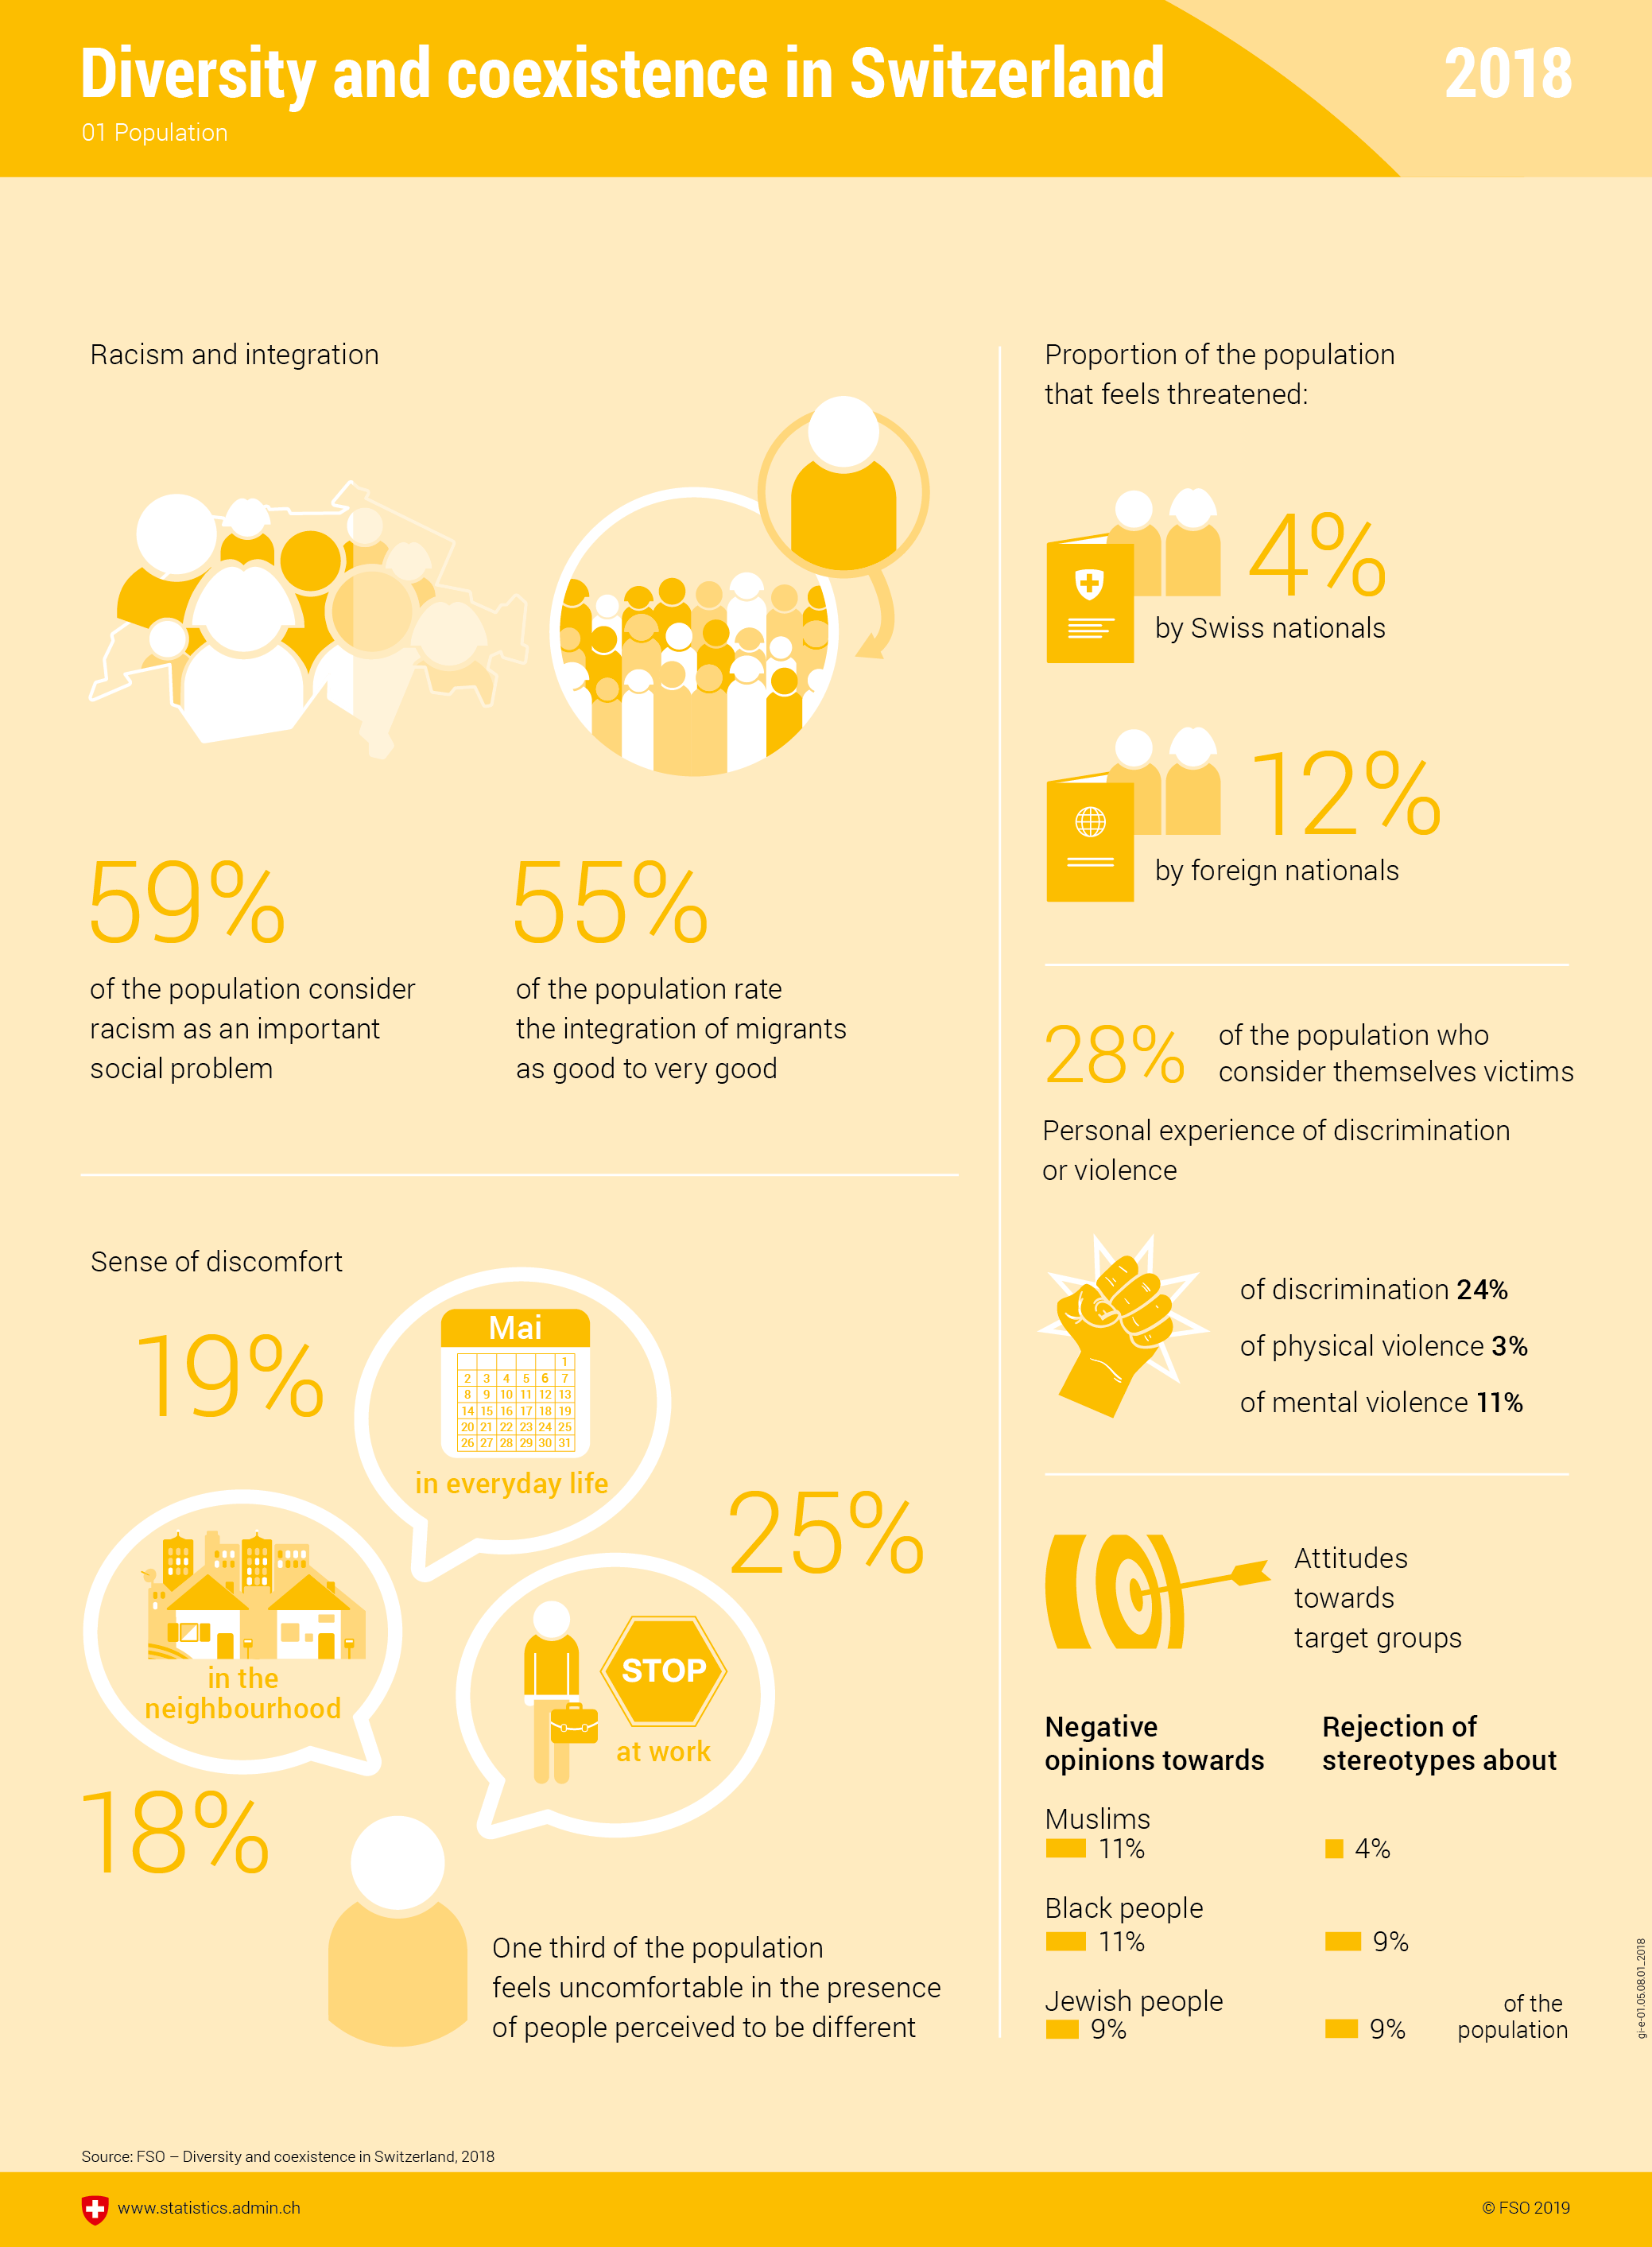
People may or may not feel uncomfortable about differences in everyday life. The potential causes of discomfort included in the survey were skin colour, nationality, language, religion and non-sedentary (itinerant) way of life. The graphic G2.1 shows, for each reason, the share of the population that said that it felt uncomfortable.
7% of the population said they felt uncomfortable in everyday life about a person whose skin colour or nationality was different. Religion (10%) and language (12%) are more likely to make people feel uncomfortable. 21% of the population feels uncomfortable in everyday life about the presence of people with an itinerant way of life, for example, people living in a caravan; this percentage is significantly higher than the percentages obtained for all the other factors.
The people who feel discomfort in everyday life specified which groups in particular they believed were the vehicles for discomfort. The group mentioned most often is “travellers” or “people living in caravans”. The second group is made up of people who are not considered to be integrated or do not wish to integrate in Switzerland. The third group is quite disparate but has in common public nuisance: people roaming the streets, clans, those who are noisy or drop litter are seen as a disturbance. Echoing cultural disparities, people who do not respect the country’s rules, do not speak a national language or are simply from a different culture are also mentioned. The unemployed and those on social assistance are also sources of discomfort in everyday life.
Discomfort depending on the situation
The strength of the feeling of discomfort can vary depending on the context and depending on the degree of contact between individuals. The graphic G2.2a analyses three different situations: everyday life, work and the neighbourhood.

34% of the population said they might feel uncomfortable when faced with differences, regardless of the situation and the cause. Coexistence with people of a different skin colour, religion, language or nationality tends to make 18% of people feel uneasy in their neighbourhood and 19% of people when it comes to their everyday life. People are significantly more likely to feel uncomfortable about cultural, ethnic or linguistic diversity at work than in other situations – 25% report discomfort.
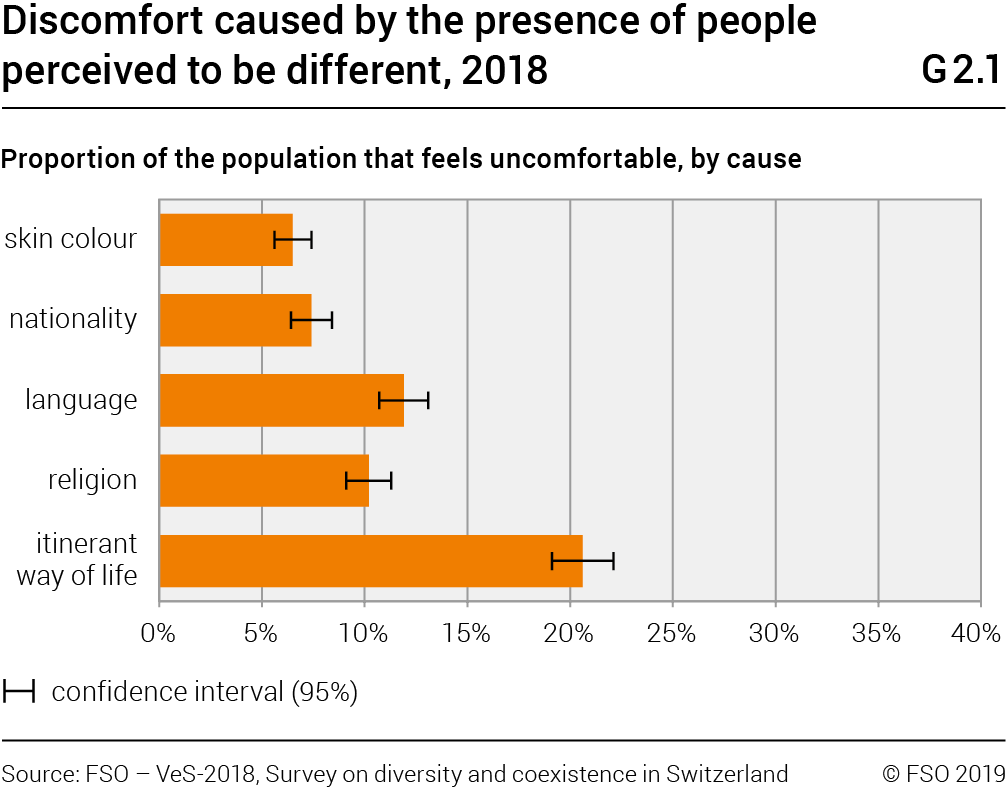
This indicator is greatly influenced by the language factor. 26% of the population say they feel uncomfortable around people speaking another language, regardless of the situation. Language-related discomfort is greater at work (20%) than in other areas of life (12%).
If this cause of discomfort is excluded from the analysis, the percentage of people that feel uncomfortable is the same in all situations. Without the language factor, the workplace can no longer be considered as a situation more likely than other contexts to cause discomfort.
Summary
In 2018, a third of Switzerland’s population said that they could feel uncomfortable when faced with differences and otherness. Being confronted with a person who speaks another language (other than one of the national languages) seems to be the most frequent cause of discomfort. This sentiment is most strongly seen in the work context. In order to work together it is necessary to understand each other; and it seems that the key to mutual understanding is mastering a national language.
3 Sense of threat
The figures below show to what extent the Swiss resident population feels threatened by groups perceived as “foreign” but also in which context this feeling is strongest. Indirectly, they reflect the potential focus of social tensions regarding specific groups and situations.
Key figures2
| Threat (overall): | |
| – non-nationals | 12% |
| – nationals | 4% |
| In the event of political conflict: | |
| – non-nationals | 63% |
| – nationals | 40% |
| On the labour market: | |
| – non-nationals | 16% |
| – nationals | 9% |
2The threat may be caused by non-nationals (foreign citizens) or nationals (Swiss citizens). The results are not broken down by the nationality of the respondents.
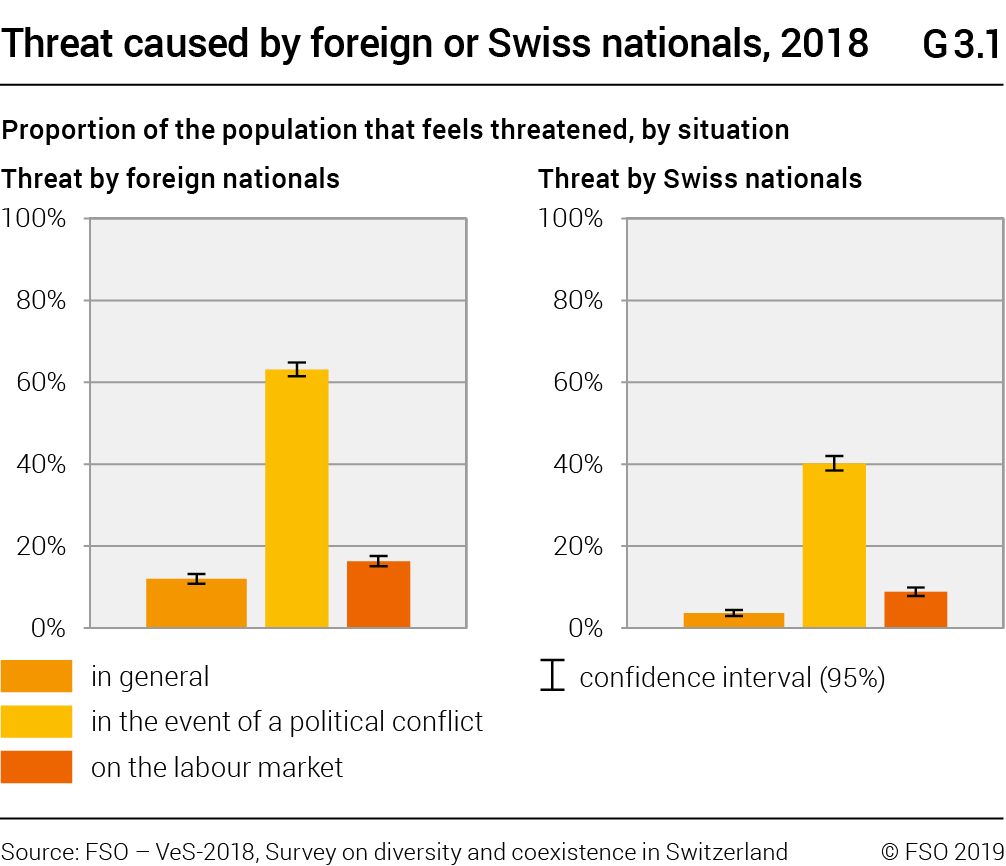
Both foreign nationals as well as Swiss citizens can experience the feeling – whether real or imaginary – of being threatened. In addition to a general feeling of being threatened, two specific situations are investigated: in the event of political conflict and on the labour market. In all cases, the percentage of people who feel threatened by Swiss nationals is lower than the percentage of those who feel threatened by foreign nationals. Furthermore, the threat is felt to be greatest in the event of political conflict. This notion is defined differently depending on the source of the perceived threat (see box Political conflict).
Political conflict
Two types of political conflict were presented in the questionnaire. One measures the reaction of Swiss nationals to foreign nationals who openly express their opinions with regard to conflicts in their country of origin. The other reflects a fear felt by non-nationals: that Swiss nationals settle their domestic political conflicts at the expense of foreigners.
Generally speaking, the percentage of the population that feels threatened is relatively low, regardless as to whether the threat is perceived to come from non-nationals (12%) or Swiss nationals (4%). On the labour market, the percentage of the population that feels threatened by non-nationals is 16%, whereas the percentage of those feeling threatened by Swiss nationals is 9%. In the event of political conflict, the percentage of persons who feel under threat is significantly greater than for other situations: 63% of people feel threatened by conflicts of non-nationals and 40% by those of Swiss nationals.
The results vary by the nationality of respondents. Persons of Swiss nationality feel considerably more threatened by non-nationals than persons of foreign nationality do (15% compared with 4%). Conversely, persons of foreign nationality feel considerably more threatened by Swiss nationals than persons of Swiss nationality do (7% compared with 2%). It is only in the case of the perceived threat from Swiss nationals on the labour market that nationality does not have any impact on the results of both sub-groups.
Summary
Stronger than the sense of discomfort, the sense of threat refers to the population’s potential fears. In 2018, few people said that they felt threatened. Regardless of the situation, non-nationals are perceived as a greater threat than Swiss nationals. Political conflicts make the population feel uneasy by increasing the sense of threat.
4 Attitudes towards foreigners
In a diverse society, the groups perceived as “foreign” are often those that are the centre of tensions. Perceptions, opinions or prejudices towards these sometimes have the effect of rejecting, excluding or discriminating against them. The population’s attitudes can, therefore, reflect real barriers (particularly structural ones) that foreigners may be confronted with in a given society.
The figures shown below give an indication of how foreign nationals living in Switzerland are perceived by the country’s population. The figures gauge attitudes towards deliberately provocative statements of a positive or negative nature. In so doing, they indicate the level of openness of the population, and focus on the interpretation of non-nationals’ rights and behaviours – both real and imaginary.
Key figures
For:
Right to family reunification 61%
Right to political participation 47%
Automatic naturalisation 57%
Against:
Expulsion in event of unemployment 67%
Abuse of social benefits 51%
Streets unsafe due to foreigners 71%
Rights and obligations
Statements relating to the rights and obligations of foreigners were made to measure the attitude of the population living in Switzerland. In general, the population is open-minded. 67% are against sending back foreign nationals should jobs become scarce, 61% are for the family reunification of foreigners who have lived for at least five years in Switzerland and 57% are for automatic naturalisation of the 2nd generation. The population is divided on the issue of the right to participate in politics such as the right to vote at communal or cantonal level to facilitate integration: 47% think that non-nationals should obtain these rights, while 52% are opposed to this.

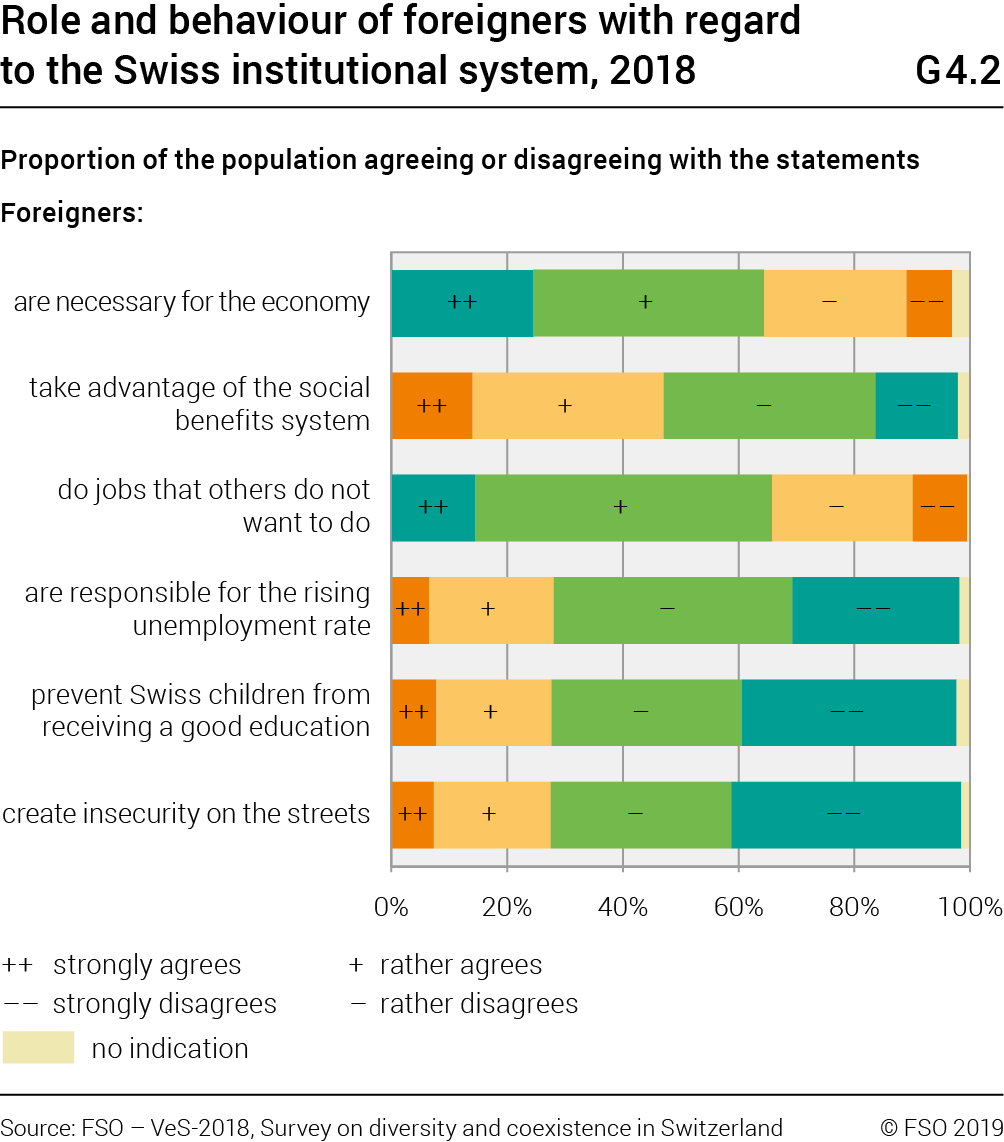
Behaviour and roles
With regard to the role and behaviour of foreign nationals in Swiss society, overall the population shows openness. 71% of people do not think that foreign nationals make the streets seem unsafe. 70% state that the presence of foreigners in the classroom does not have a negative effect on the education of Swiss children. The same percentage (70%) reject the idea that foreigners are responsible for any increase in unemployment. Furthermore, a majority considers that the foreign population is useful to Switzerland and the functioning of the country. 66% think that foreign nationals do the work that Swiss natives do not want to do and 64% that they are necessary for the economy to function properly and to fund the social security system. The population is divided over the statement that they take advantage of social benefits such as OASI and DI: 51% reject it, while 47% agree with it.
Summary
In 2018, the population believes that more rights should be granted to persons of foreign nationality living in Switzerland, especially the right to family reunification and the right to facilitated naturalisation for the 2nd generation, i. e. the children of migrants born in Switzerland. The population also believes that non-nationals are useful to society on account of their employment and their contribution to the funding of social benefits. The population does, however, fear the potential for abuse of the system.
5 Attitudes towards target groups
In the current climate, social tensions can be seen to focus on Muslims, as well as on other “visible minorities” such as Black people, migrant populations but also Jewish people.
By capturing stereotypes or opinions, the figures shown here provide information on the attitudes of the population in Switzerland towards three groups: Muslims, Black people and Jewish people. Attitudes towards groups change depending on the indicator, notably reflecting the different methodology choices and approaches.
Key figures
| Muslims | Black people | Jewish people | |
|---|---|---|---|
| Refusal to rank the groups | 93% | 93% | 95% |
| Absolute refusal to rank the groups | 71% | 74% | 75% |
| Rejection of stereotypes | 4% | 9% | 9% |
| Agreement with stereotypes | 14% | 7% | 12% |
| Hostility | 11% | 11% | 9% |
| Mistrust of religion | 29% |
Refusal to rank the groups
The first indicator aims to ascertain whether the target groups of the survey are perceived equally or not by the population living in Switzerland.
In the majority of cases, the population’s assessment of Muslims, Black and Jewish people is a positive one. The proportion of the population agreeing with the statement Proportion of the population that agrees or strongly agrees with the statement. that the groups are like any other groups is 93% with regard to Muslims, 95% for Jewish people and 95% for Black people.
Among those who strongly agree with the statement (absolute refusal to rank the groups), different tendencies are observed. A difference can be seen between the attitude towards Muslims and that towards the two other groups. The population shows more reservation towards Muslims. 71% believe that Muslims have both their good and their bad points while 74% have the same opinion of Black people and 75% of Jewish people.

Stereotypes: between agreement and rejection
The second indicator focuses on the reactions to stereotypes and also enables an understanding of how Muslims, Black and Jewish people are perceived by the population living in Switzerland.
List of stereotypes
| Muslims | Black people | Jewish people |
|---|---|---|
| Fanaticism | Lazy workers | Greediness |
| Aggressiveness | Violence | Keep too much to themselves |
| Oppression of women | Disrespect of rules | Power hungry |
| Disrespect of human rights | Profiteers | Political radicalism |
The graphic G5.2 below shows two possible types of reaction upon being presented with a series of negative stereotypes relating to the groups: consistent agreement with or consistent rejection of the attributes presented.
The proportion of the population that thinks the negative characteristics ascribed to Muslims are highly relevant is 14%. It drops to 12% with regard to Jewish people and to 7% for Black people. This means that the proportion of people that consistently accept negative characteristics is two times higher with regard to Muslims and Jewish people than it is towards Black people. These figures indicate that preconceived stereotypical perceptions of Black people are more favourable than those of the other target groups.

With regard to Muslims, the sizeable agreement with negative characteristics (14%) is accompanied by a low rejection rate of negative characteristics, i. e. the lowest rejection recorded for the three groups observed (4%). For Black people, the proportion of the population that consistently rejects the characteristics is higher (9%) compared with the first group. For Jewish people, agreement and rejection are both relatively high (12% agreement, 9% rejection).
Note: the percentages shown were greatly influenced by the stereotypes chosen to be presented to respondents during the survey. The number of stereotypes proposed also influences the results.
Hostility
The hostility towards various groups of the population is measured using indices constructed on the basis of groupings of negative statements. Indirectly, the figures below reflect phenomena such as racism and anti-Semitism.
As indicated, these indices correspond to a grouping of several statements about the target groups. This approach enables opinions to be recorded not on the basis of one answer, but on the basis of several. In this way, an opinion is only qualified as hostile, racist or anti-Semitic if this tendency can be observed throughout the statements presented to respondents.
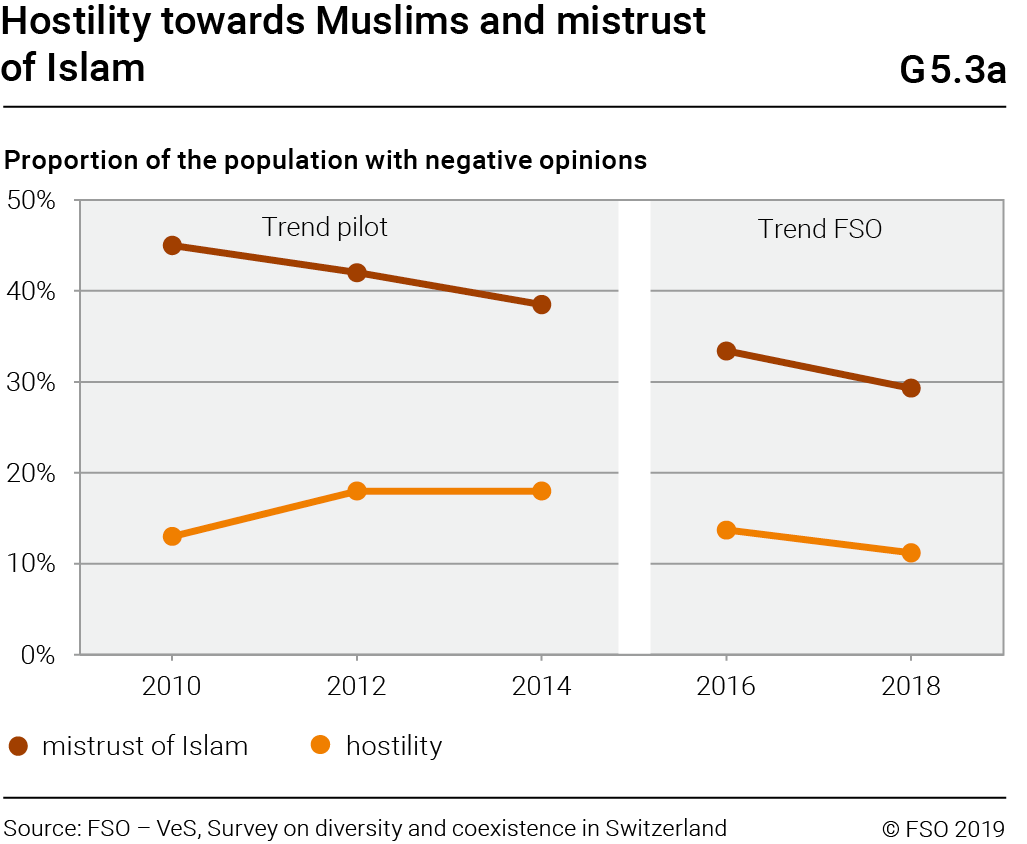
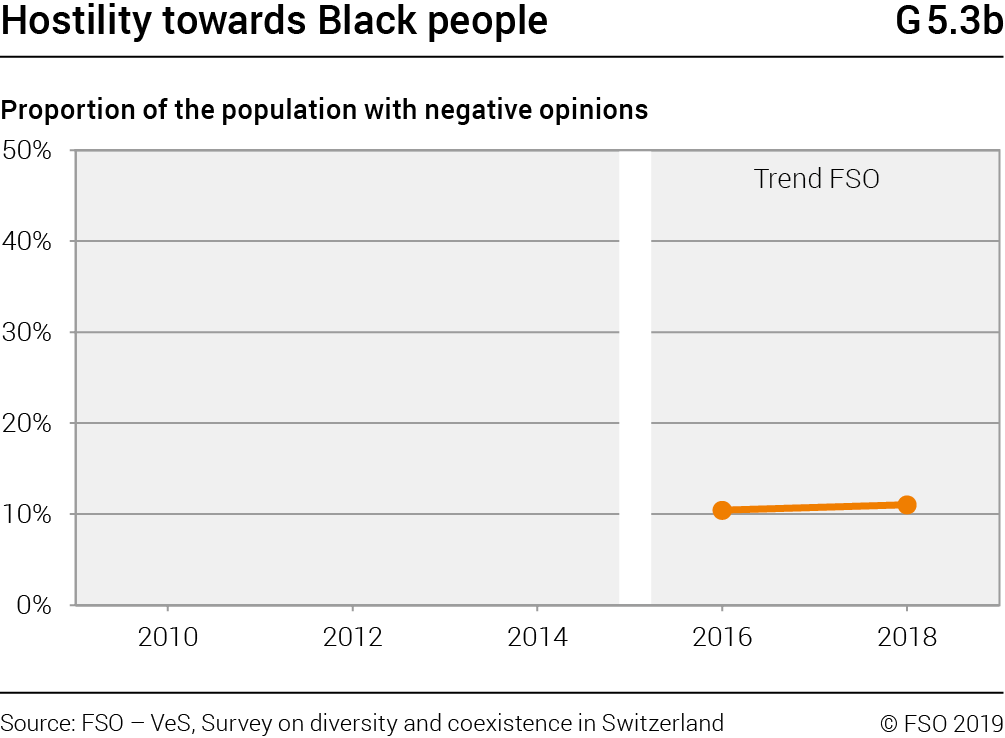
Due to changes in the methodology Sampling, weighting and interview technique. , data from the 2010, 2012 and 2014 pilot surveys and the data from 2016 and 2018 are not directly comparable and as a consequence, there is a break in the series between 2014 and 2016.
In 2018, the proportion of the population hostile towards Muslims – i. e. making negative judgements against them – was 11%. In order to obtain a more complete picture of the population’s attitude towards Muslims, the hostility index can be compared with the index measuring mistrust of Islam. The proportion of people who disapprove of Islam is 29%. Mistrust of religion is thus almost three times as high as hostility towards the group (measured without explicit reference to religion or to religious practices). Compared with other years, the value of this index decreased.
In 2018, the proportion of the population hostile towards Black people was 11%. This percentage should be regarded with caution, as the data on this group have not yet been analysed in detail. Such analysis will be possible after the third series of the survey.
In 2018, the proportion of the population hostile towards Jewish people was 9%, i. e. one percentage point higher than in 2016.

Summary
Attitudes towards the target groups change according to indicator and the methodology used. In 2018, the population’s perceptions of Muslims tended to be less favourable than its perception of the other groups studied in the survey. More than a rejection of the group in an ethnic sense, it is the religious aspects that seem to be the focus of tensions.
6 Experience of discrimination
Discrimination is the unequal treatment of a group or person with “other” characteristics. It describes the structural and individual obstacles that people of different affiliations or backgrounds can meet in all areas of life.
The figures shown below indicate how many people feel discriminated against and which groups are most likely to experience negative treatment. Everyday situations in which discriminatory actions or words are experienced are also included. Indirectly, these figures reflect the focus of social tensions regarding specific groups and situations.
Key figures
Discrimination 24%
Racial discrimination 17%
Mental violence 11%
Physical violence 3%
Total 28%
Discrimination and violence
Discrimination can take different forms such as physical or mental violence. The diagram G6.1 shows the types of negative treatment that people are confronted with due to their being part of a group at risk of discrimination defined by nationality, religion, sexual orientation, political opinions, distinctive physical appearance or any other reason.

The various experiences (discrimination, mental and physical violence) differ significantly from one another. Among the population as a whole, 3% say that they have been subject to physical violence, 11% to mental violence and 24% to discrimination. 28% of this population say that they have been subjected to at least one type of discrimination in the five years prior to the 2018 survey on account of their affiliation to a group. Focusing only on ethno-racial The following criteria are taken into consideration in the calculation of percentages: nationality, ethnicity, religion, skin colour and other physical features. aspects, the share of victims amounts to 17%; this is racial discrimination.
The presented findings are the subject of a self-assessment by target persons. This is why the percentages presented do not tally with the cases of discrimination recorded in counselling or reporting centres (explicit incidents, without conviction) or sentences (explicit incidents, sentenced in court).
Grounds for discrimination
The diagram G6.2 shows the most common grounds for negative treatment.
Among persons saying they had experienced discrimination in Switzerland, nationality is by far the characteristic most mentioned by victims. Language is also an attribute that stands out from those that follow. 58% of persons said they were discriminated against because of their nationality and 27% because of their language, dialect or accent. A second group of grounds mentioned included gender (19%), professional position (18%), religion (15%), distinctive physical features such as skin colour (15%), socio-economic level (14%), age (13%), political and other opinions (12%) and ethnicity (11%), all with similar percentages. Lastly, 6% of victims say they have been subject to unfair treatment because of their sexual orientation. The latter reason differs from the previous ones on account of its lower percentage. Due to the small number of cases reported in the survey, discrimination due to disability is not presented.

Situations in which discrimination occurs
The diagram G6.3 shows the areas of life in which discrimination most frequently occurs in Switzerland.
Among people saying they have experienced discrimination, half (50%) say it has occurred at work or when looking for work. The workplace is the most common situation for discrimination, ahead of all others. A second group of situations are mentioned next: 25% of victims say they have been subject to unfair treatment in public spaces, 24% in other non-specified situations and 19% in the scope of their compulsory training and education or during their higher education. 10% of victims experienced such treatment when looking for accommodation, when practising sport, in their leisure time or when dealing with the public administration. 8% said they have experienced unfair treatment in the family, in their private life or when dealing with the police and 7% when entering a restaurant, bar or club. With similar percentages, the differences between the latter situations mentioned above are only minimal. Due to the small number of cases reported, discrimination experienced in the army, when seeking social assistance or medical services is not presented.

Summary
In 2018, one quarter of Switzerland’s population said that they have been a victim of discrimination or violence during the past five years on account of their affiliation to a group. Among the victims, most said that their nationality was the main reason. The world of work, both in terms of access to the labour market and in day-to-day life, is the place in which discrimination most frequently occurs. Discrimination in public spaces increased in comparison with 2016.
Bibliography
National Consultative Commission on Human Rights, CNCDH France, 2016. The fight against racism, anti-Semitism and xenophobia, 2015 report.
FSO, 2019. Findings from the survey on diversity and coexistence in Switzerland (VeS), web pages. www.statistics.admin.ch → Look for statistics → Population → Migration and integration → Diversity and coexistence in Switzerland
SLR, 2017. Racial discrimination in Switzerland, 2016 report Electronic version, URL: www.edi.admin.ch/edi/en/home/fachstellen/frb/berichterstattung-und-monitoring/bericht--rassistische-diskriminierung-in-der-schweiz-.html .