At the end of 2018, Switzerland had a population of 8 544 527, i.e. 60 397 persons (+ 0.7%) more than in 2017. The number of Swiss nationals in the population was 6 396 252 and the number of foreign nationals 2 148 275.
Permanent resident populationT1
| 1970 | 1980 | 1990 | 2000 | 2018 | |
|---|---|---|---|---|---|
| Total | 6 193 064 | 6 335 243 | 6 750 693 | 7 204 055 | 8 544 527 |
| Swiss | 5 191 177 | 5 421 746 | 5 623 584 | 5 779 685 | 6 396 252 |
| Foreigners | 1 001 887 | 913 497 | 1 127 109 | 1 424 370 | 2 148 275 |
| Men | 3 025 330 | 3 081 965 | 3 298 312 | 3 519 698 | 4 237 121 |
| Women | 3 167 734 | 3 253 278 | 3 452 381 | 3 684 357 | 4 307 406 |
Sources: FSO – ESPOP, STATPOP
© FSO 2019
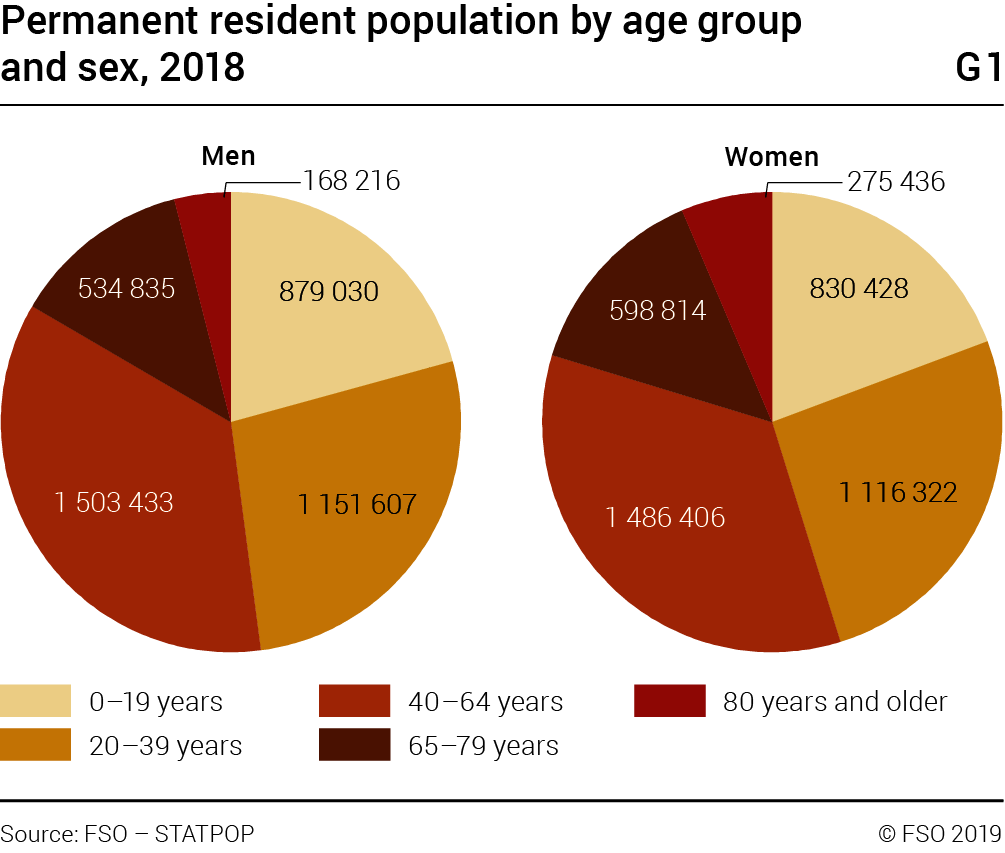
The permanent resident population comprises slightly more women than men (50.4% to 49.6%). While men are greater in number in the younger age groups, the gap between men and women narrows between the ages of 20 and 39 when they are represented in almost identical numbers. From the age of 60, there are more and more women, who have a longer life expectancy.
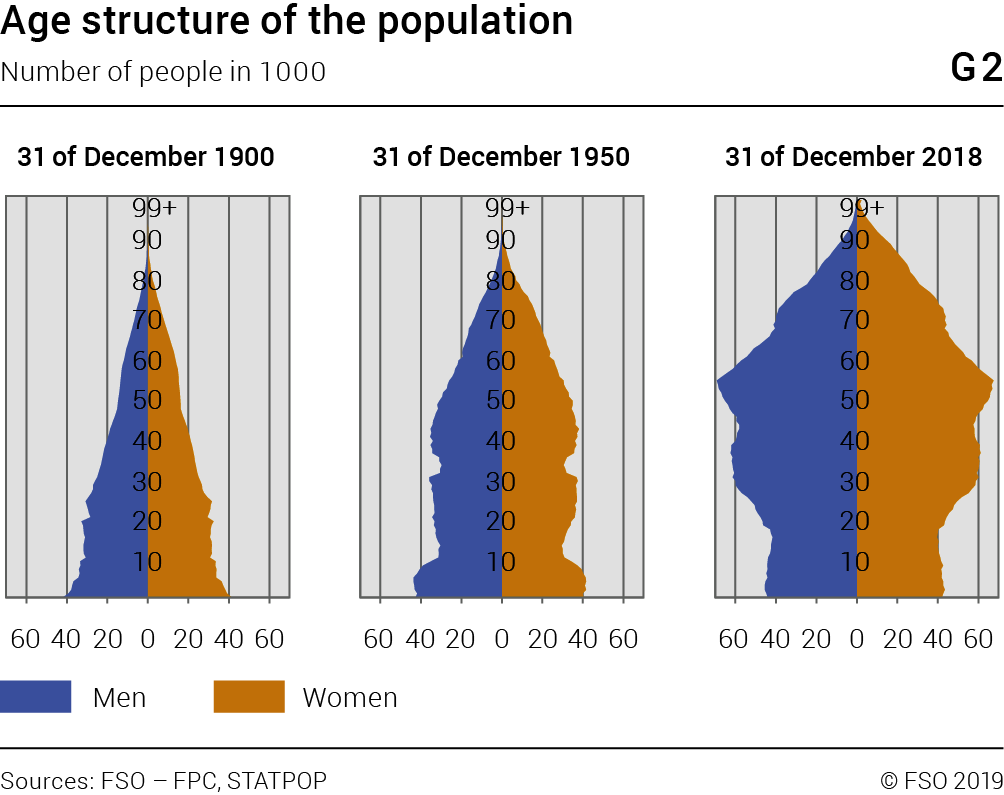
The population’s age structure has undergone great change since 1900. The share of young people under the age of 20 has declined, whereas that of people over the age of 64 has increased. This phenomenon is a result of the extension of life expectancy and of a decline in fertility. As a consequence, the population is ageing.
In 2018, 2.1 million foreign nationals were living in Switzerland, 19% of whom were born in Switzerland and 81% abroad.
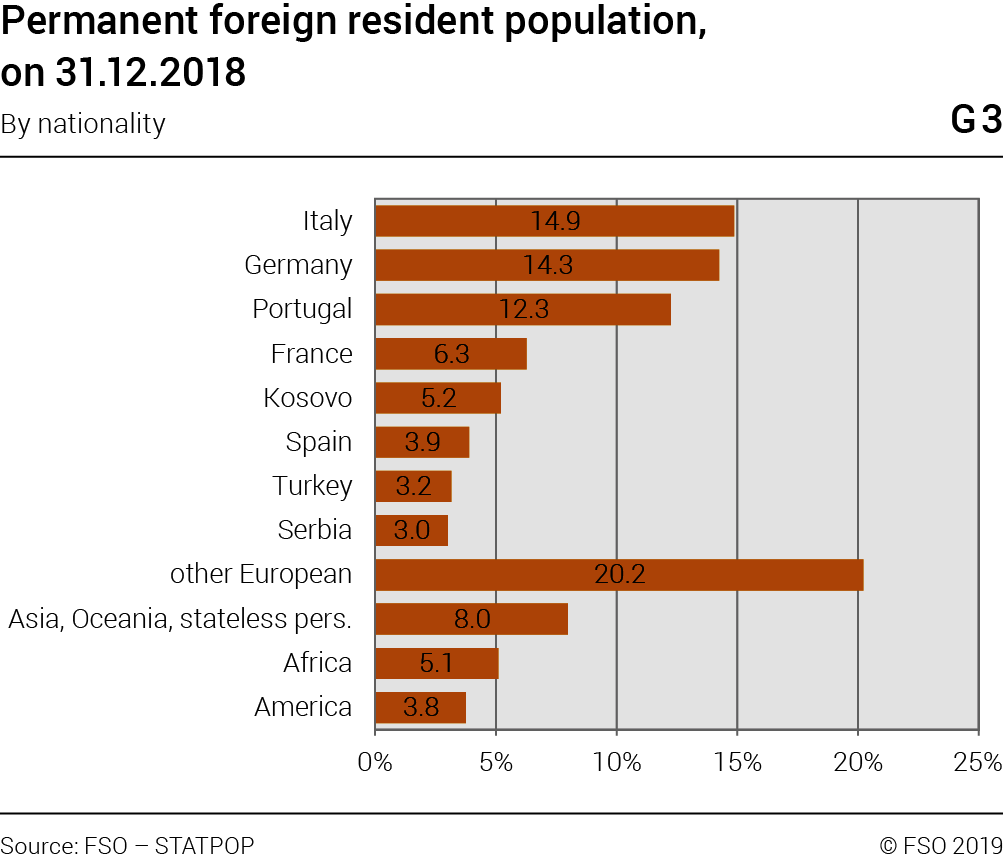
The most common foreign nationalities in Switzerland are Italian, German, Portuguese, French and Kosovar.
In 1910, 14.7% of the population living in Switzerland were foreigners; this rate was not surpassed until 1967. Except for a drop in the years from 1975 to 1979 and a slight decline in 1983, the percentage of foreign nationals has continued to rise, reaching 25% at the end of 2018.
Dual citizenship
18.1% of the Swiss permanent resident population aged 15 or over have dual citizenship (966 023 people). 64.3% of them obtained Swiss nationality by naturalisation, whereas 35.7% have been Swiss nationals from birth.
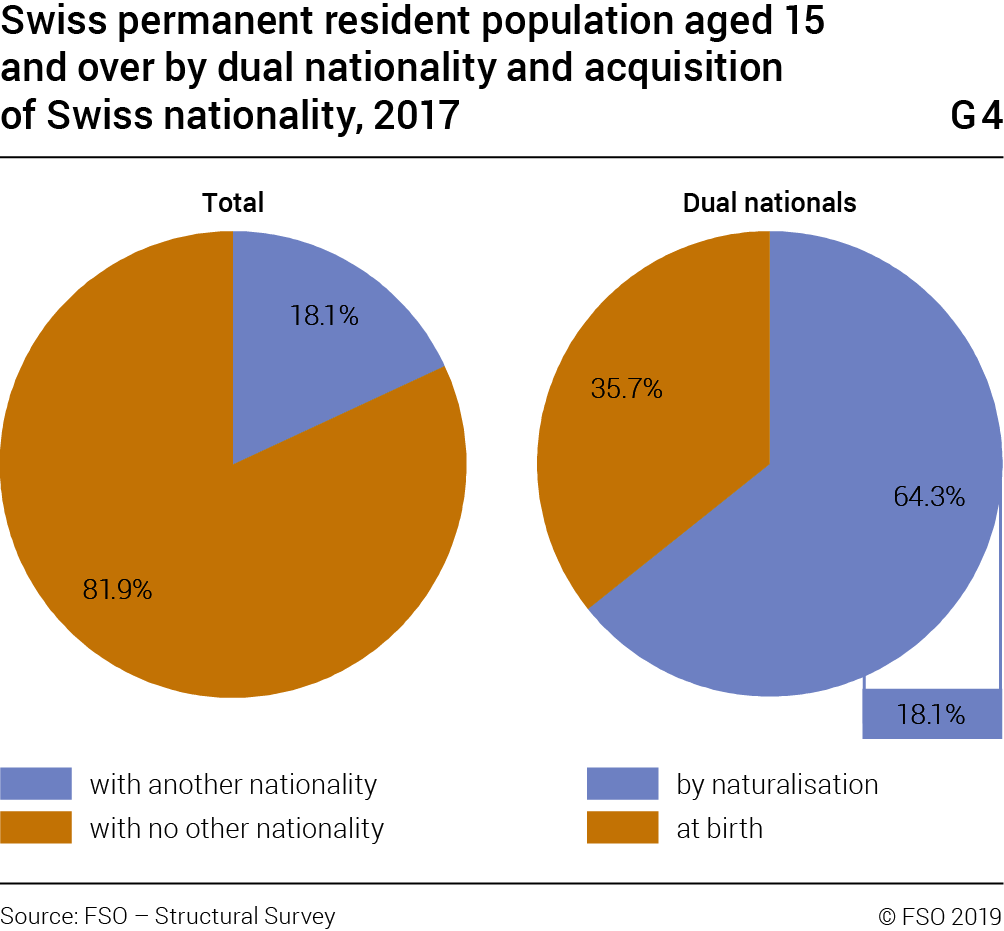
The most common second nationality among dual nationals is Italian (24.2%), followed by French (11.2%) and German (8.2%).
Broken down by marital status, the permanent resident population was composed as follows in 2018: 44.4% of people were single, never married, 42.1% married, 4.7% widowed, 8.5% divorced, 0.01% whose marriage has been annulled, 0.2% in a registered partnership and 0.03% in a dissolved partnership.

At the end of 2018, 53.2% of single, never married people were men and 46.8% women. In contrast, the distribution of men and women among married people was more or less equal. Women are in the majority (57.7%) among divorced people. People in a registered partnership, on the other hand, are more likely to be male (66.3%) than female (33.7%). The gender gap is considerable among widowed persons: 80.4% of them are women. This difference can be explained by women’s longer life expectancy and also by the fact that men are more likely to remarry.
Population by canton
At the end of 2018, Zurich remained the most populated canton in Switzerland with more than 1.5 million inhabitants. Appenzell Innerrhoden was the least populated (16 145). Almost 60% of the country’s population is concentrated in six cantons: Zurich, Bern, Vaud, Aargau, Saint Gallen and Geneva.
Permanent resident population by canton, 2018T2
| Total | Men | Women | Swiss | Foreigners | |
|---|---|---|---|---|---|
| Switzerland | 8 544 527 | 4 237 121 | 4 307 406 | 6 396 252 | 2 148 275 |
| Zurich | 1 520 968 | 757 081 | 763 887 | 1 112 574 | 408 394 |
| Bern | 1 034 977 | 507 791 | 527 186 | 865 906 | 169 071 |
| Lucerne | 409 557 | 204 100 | 205 457 | 333 672 | 75 885 |
| Uri | 36 433 | 18 609 | 17 824 | 31 936 | 4 497 |
| Schwyz | 159 165 | 81 599 | 77 566 | 124 828 | 34 337 |
| Obwalden | 37 841 | 19 144 | 18 697 | 32 296 | 5 545 |
| Nidwalden | 43 223 | 22 122 | 21 101 | 36 872 | 6 351 |
| Glarus | 40 403 | 20 448 | 19 955 | 30 671 | 9 732 |
| Zug | 126 837 | 64 195 | 62 642 | 90 917 | 35 920 |
| Fribourg | 318 714 | 159 579 | 159 135 | 246 355 | 72 359 |
| Solothurn | 273 194 | 136 475 | 136 719 | 211 399 | 61 795 |
| Basel-Stadt | 194 766 | 94 311 | 100 455 | 123 867 | 70 899 |
| Basel-Landschaft | 288 132 | 141 341 | 146 791 | 222 396 | 65 736 |
| Schaffhausen | 81 991 | 40 560 | 41 431 | 60 626 | 21 365 |
| Appenzell A.Rh. | 55 234 | 27 889 | 27 345 | 46 220 | 9 014 |
| Appenzell I.Rh. | 16 145 | 8 300 | 7 845 | 14 321 | 1 824 |
| St. Gallen | 507 697 | 254 304 | 253 393 | 385 295 | 122 402 |
| Graubünden | 198 379 | 99 374 | 99 005 | 161 397 | 36 982 |
| Aargau | 678 207 | 340 776 | 337 431 | 507 783 | 170 424 |
| Thurgau | 276 472 | 139 185 | 137 287 | 207 714 | 68 758 |
| Ticino | 353 343 | 172 192 | 181 151 | 255 116 | 98 227 |
| Vaud | 799 145 | 392 529 | 406 616 | 533 878 | 265 267 |
| Valais | 343 955 | 170 431 | 173 524 | 265 879 | 78 076 |
| Neuchâtel | 176 850 | 86 621 | 90 229 | 132 143 | 44 707 |
| Geneva | 499 480 | 241 848 | 257 632 | 299 540 | 199 940 |
| Jura | 73 419 | 36 317 | 37 102 | 62 651 | 10 768 |
Source: FSO – STATPOP
© FSO 2019
Men and women are not equally distributed across the cantons. Women dominate in half of the cantons, particularly in Basel-Stadt and Geneva: in the other half, men dominate, in particular in Appenzell Innerrhoden and Schwyz.
The cantons of Fribourg and Vaud have the largest percentages of young people; these two cantons show the lowest average age, i.e. just below 41. The proportion of elderly people is greatest in Basel-Landschaft and Ticino. At present, the average age in these cantons is above 44.
The cantons with the highest percentages of foreign nationals are Geneva (40%), Basel-Stadt (36.4%) and Vaud (33.2%). Appenzell Innerrhoden and Uri show the lowest proportion of foreigners (11.3% and 12.3%), followed by Obwalden, Jura and Nidwalden (less than 15% in all three cases).