At the end of 2017, the permanent resident population by civil status was composed as follows: 44.3% single, 42.3% married, 4.8% widowed, 8.4% divorced, 0.01% unmarried, 0.19% persons in a registered partnership and 0.02% persons in a dissolved partnership.
At the end of 2017, 53.2% of single people were men and 46.8% women. Among married persons, the gender percentages were fairly balanced. Men, did, however account for the slightly larger group with 50.6% (women: 49.4%).
At 57.6%, women were over-represented among divorced people. In contrast, differences could be seen in registered partnerships: More men continued to be in a registered partnership than women (67% compared with 33%).
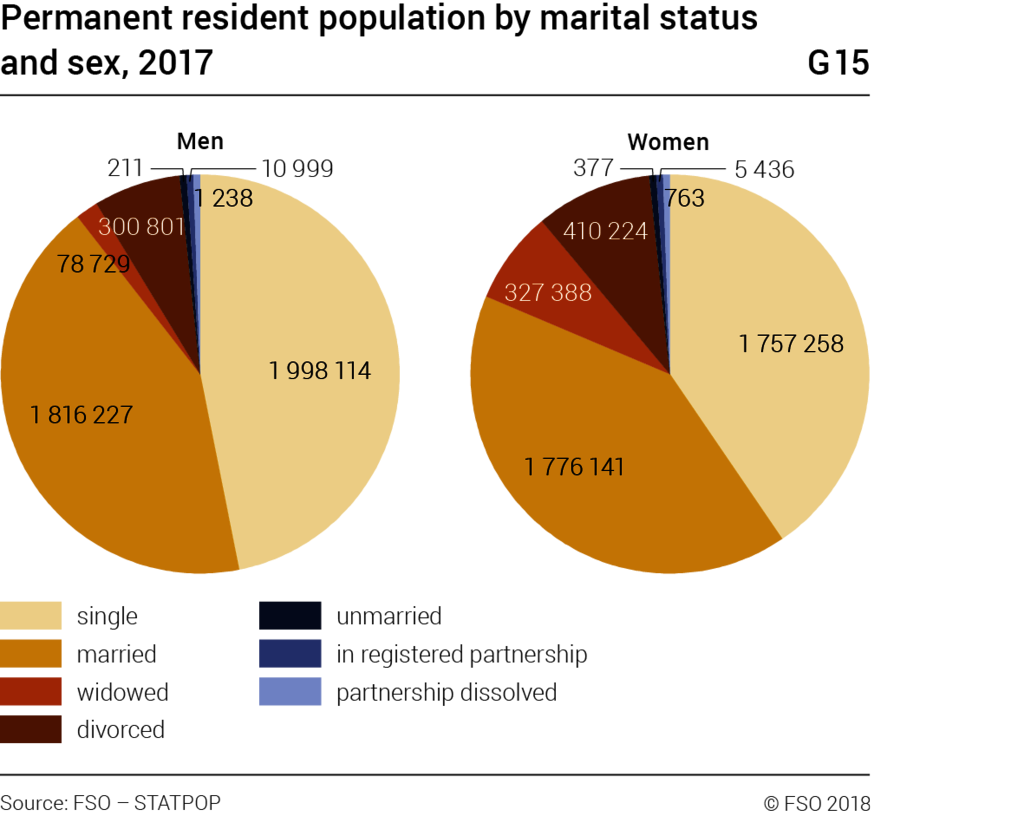
With regard to widowed persons, a big difference could be observed: 81.0% were women. The reasons for this are the higher life expectancy of women and the greater propensity of men to remarry.
Marriages
In 2017, 40 599 couples tied the knot. 71.3% of these (28 954) were first-time marriages. In 11 645 of these marriages, at least one person had been married before. The average age at first marriage continues to rise. Whereas in 1970, men were aged 26.5 and women 24.1, on average men and women today get married at the ages of 32,0 and 29.9 respectively.
MarriagesT7
| 1970 | 1980 | 1990 | 2000 | 2017 | |
|---|---|---|---|---|---|
| Total | 46 693 | 35 721 | 46 603 | 39 758 | 40 599 |
| Men | |||||
| single | 41 536 | 30 212 | 38 316 | 30 467 | 32 119 |
| widowed | 1 437 | 791 | 795 | 618 | 426 |
| divorced1 | 3 720 | 4 718 | 7 492 | 8 673 | 8 045 |
| Women | |||||
| single | 42 607 | 31 175 | 39 624 | 31 531 | 33 200 |
| widowed | 950 | 417 | 436 | 432 | 314 |
| divorced1 | 3 136 | 4 129 | 6 543 | 7 795 | 7 085 |
| Average age at first marriage (in years) | |||||
| Men | 26.5 | 27.4 | 29.1 | 30.3 | 32.0 |
| Women | 24.1 | 25.0 | 26.7 | 27.9 | 29.9 |
1 incl. other marital status
Sources: FSO – BEVNAT, ESPOP, STATPOP
© FSO 2018
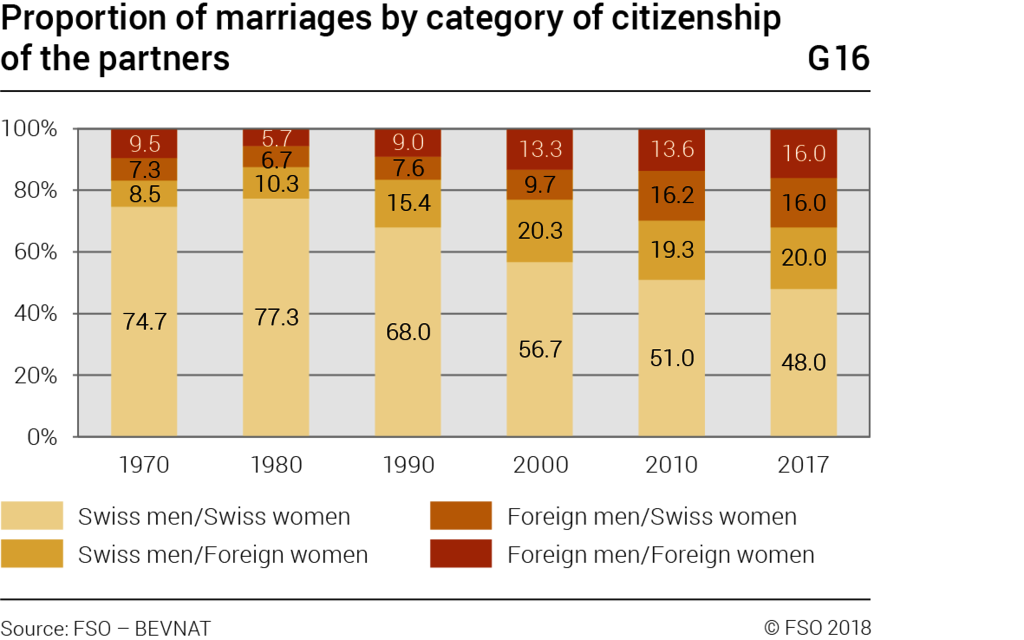
Since the middle of the 1980s, an increase in marriages with at least one foreign partner has been observed. In 2017, this was the case for 21 041 marriages (51.8%), 14 522 of which were between a Swiss and a foreign national (35.8%).
Registered and dissolved partnerships
789 same-sex couples entered a registered partnership in 2017. Far more male couples entered registered partnerships than female couples. However, in 2016 a considerable increase was nonetheless observed among female couples (+34.8%) while registered partnerships among men declined (–3.0%).
Registered and dissolved partnershipT8
| 2007 | 2010 | 2017 | |
|---|---|---|---|
| Registered | |||
| Total | 2 004 | 720 | 789 |
| Couples (Men) | 1 431 | 499 | 483 |
| Couples (Women) | 573 | 221 | 306 |
| Dissolved | |||
| Total | 1 | 77 | 183 |
| Couples (Men) | 1 | 49 | 117 |
| Couples (Women) | 0 | 28 | 66 |
Source: FSO – BEVNAT
© FSO 2018
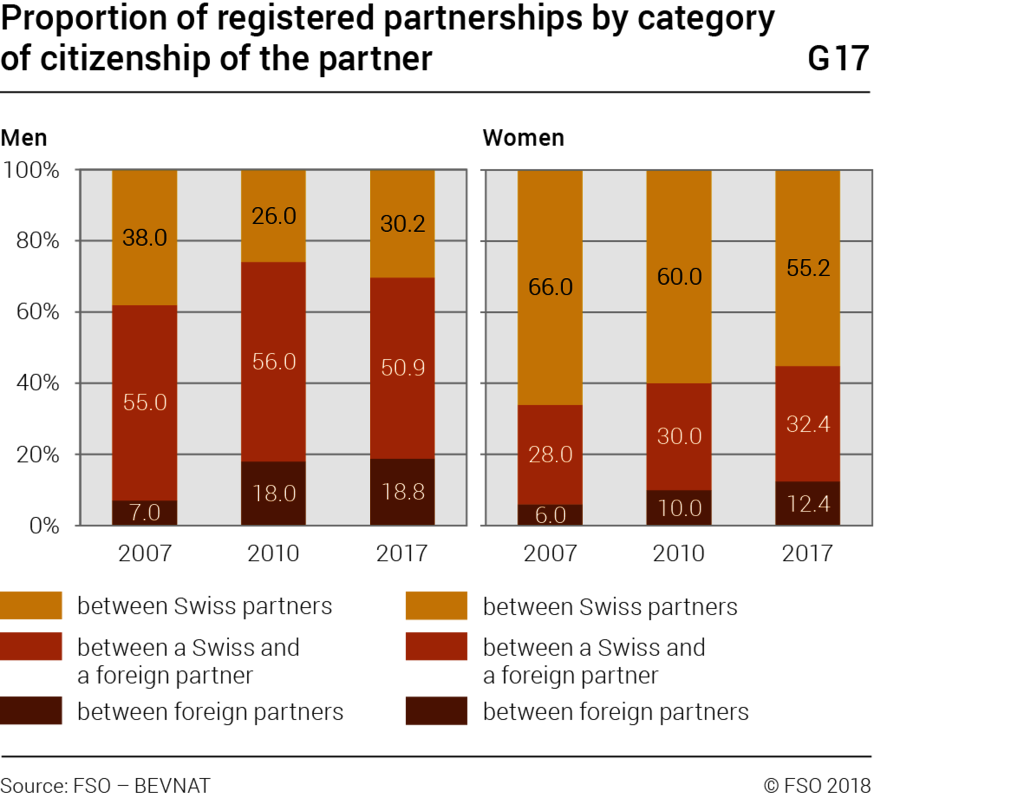
In female couples both partners tend to be Swiss nationals, whereas in male couples partnerships between persons of different nationalities are most common.
DivorcesT9
| 1970 | 1990 | 2010 | 2017 | |
|---|---|---|---|---|
| Total | 6 406 | 13 184 | 22 081 | 15 906 |
| Duration of marriage | ||||
| 0–4 years | 1 568 | 3 128 | 2 454 | 1 900 |
| 5–9 years | 1 926 | 3 473 | 6 117 | 3 917 |
| 10–14 years | 1 143 | 2 051 | 4 087 | 3 039 |
| 15–19 years | 778 | 1 679 | 3 216 | 2 300 |
| 20 years and over | 991 | 2 853 | 6 207 | 4 750 |
|
Average duration of marriage at time of divorce (in years) |
11.6 | 11.9 | 14.5 | 15.1 |
| Total divorce rate | 15.4 | 33.2 | 54.4 | 38.7 |
Source: FSO – BEVNAT
© FSO 2018
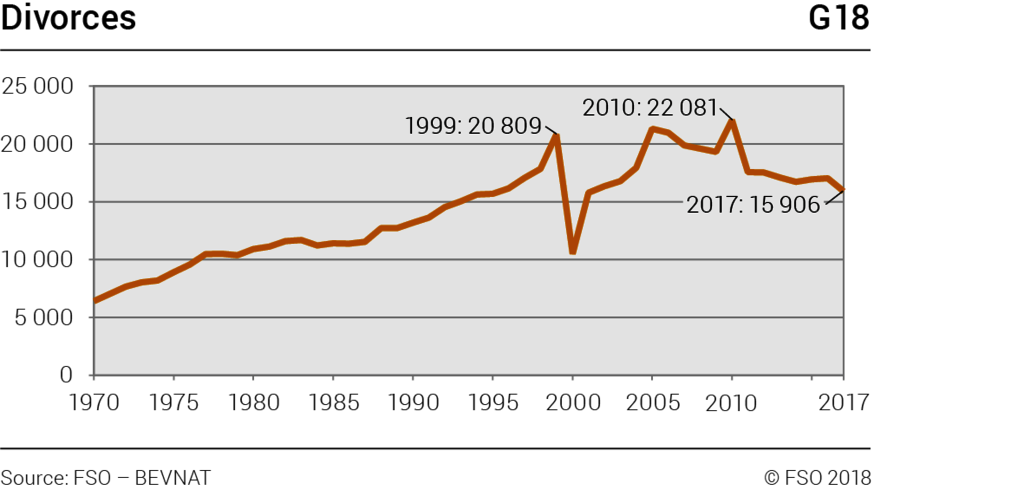
Divorces
In 2017, 15 906 divorces were recorded. Divorces were most frequent in the case of marriages that lasted 20 or more years (29.9%).
After 1970, divorces have increased. Since 2010, however, there has been a slight decline in the number of divorces. The strong increases in 1999 and 2010 were linked to the new divorce law and revisions to the law which came into force on 1 January 2000 and 1 January 2011.