Permanent resident population by canton, 2016
| At year-end | Total in ’000 |
Foreigners in % |
Urban in % |
Density km2 | Population growth 2010 – 2016 in % |
|---|---|---|---|---|---|
| Switzerland | 8 419.6 | 25.0 | 84.6 | 210.5 | 7.0 |
| Zurich (ZH) | 1 488.0 | 26.6 | 99.3 | 895.9 | 8.4 |
| Bern (BE) | 1 026.5 | 16.1 | 74.6 | 175.8 | 4.8 |
| Lucerne (LU) | 403.4 | 18.4 | 63.8 | 282.3 | 6.8 |
| Uri (UR) | 36.1 | 11.9 | 88.4 | 34.2 | 2.0 |
| Schwyz (SZ) | 155.9 | 20.7 | 82.0 | 183.1 | 6.2 |
| Obwalden (OW) | 37.4 | 14.7 | 27.4 | 77.8 | 5.0 |
| Nidwalden (NW) | 42.6 | 14.2 | 50.7 | 176.3 | 3.7 |
| Glarus (GL) | 40.1 | 23.7 | 76.2 | 59.0 | 4.0 |
| Zug (ZG) | 123.9 | 27.5 | 100.0 | 598.3 | 9.6 |
| Fribourg (FR) | 311.9 | 22.4 | 74.3 | 195.8 | 12.0 |
| Solothurn (SO) | 269.4 | 22.0 | 86.1 | 340.9 | 5.5 |
| Basel-Stadt (BS) | 193.1 | 35.8 | 100.0 | 5 225.2 | 4.4 |
| Basel-Landschaft (BL) | 285.6 | 22.3 | 97.6 | 551.7 | 4.1 |
| Schaffhausen (SH) | 80.8 | 25.9 | 89.8 | 270.9 | 5.8 |
| Appenzell A. Rh. (AR) | 55.0 | 16.2 | 76.5 | 226.3 | 3.7 |
| Appenzell I. Rh. (AI) | 16.0 | 11.1 | 0.0 | 92.8 | 2.0 |
| St. Gallen (SG) | 502.6 | 23.8 | 82.5 | 257.6 | 4.9 |
| Graubünden (GR) | 197.6 | 18.5 | 44.8 | 27.8 | 2.6 |
| Aargau (AG) | 663.5 | 24.7 | 85.1 | 475.6 | 8.5 |
| Thurgau (TG) | 270.7 | 24.5 | 67.2 | 313.6 | 9.0 |
| Ticino (TI) | 354.4 | 28.1 | 92.0 | 129.3 | 6.2 |
| Vaud (VD) | 784.8 | 33.6 | 89.6 | 278.2 | 10.0 |
| Valais (VS) | 339.2 | 23.2 | 75.5 | 65.1 | 8.5 |
| Neuchâtel (NE) | 178.6 | 25.6 | 89.8 | 249.1 | 3.8 |
| Geneva (GE) | 489.5 | 40.2 | 100.0 | 1 991.4 | 6.9 |
| Jura (JU) | 73.1 | 14.6 | 53.2 | 87.2 | 4.4 |
© FSO 2018
Permanent resident population in the largest cities, 2016
| City | Urban agglomeration | |||
|---|---|---|---|---|
| in ’000 | Population growth 2010 – 2016 in % |
in ’000 | Population growth 2010 – 2016 in % |
|
| Zurich | 402.8 | 8.0 | 1 354.1 | 8.4 |
| Geneva | 199.0 | 6.1 | 585.4 | 7.5 |
| Basel | 171.0 | 4.8 | 545.3 | 4.6 |
| Lausanne | 137.8 | 7.8 | 415.6 | 9.6 |
| Bern | 133.1 | 7.0 | 415.5 | 6.0 |
| Winterthur | 109.8 | 8.4 | 140.2 | 7.9 |
| Lucerne | 81.6 | 5.3 | 228.3 | 5.8 |
| St. Gallen | 75.5 | 3.5 | 166.4 | 3.7 |
| Lugano | 63.9 | 6.1 | 151.7 | 7.4 |
| Biel | 54.5 | 6.4 | 105.4 | 5.9 |
© FSO 2018
The population is mostly urban
Today (2016), 84.6% of the urban population live in areas with an urban character (urban cores and areas under the influence of urban centres). About half of the population live in one of Switzerland’s five largest agglomerations (Zurich, Basel, Geneva, Bern and Lausanne).
In 2016 population growth in areas with an urban character was stronger than in areas beyond the influence of urban centres (2015: +1.2% compared with +0.7%).
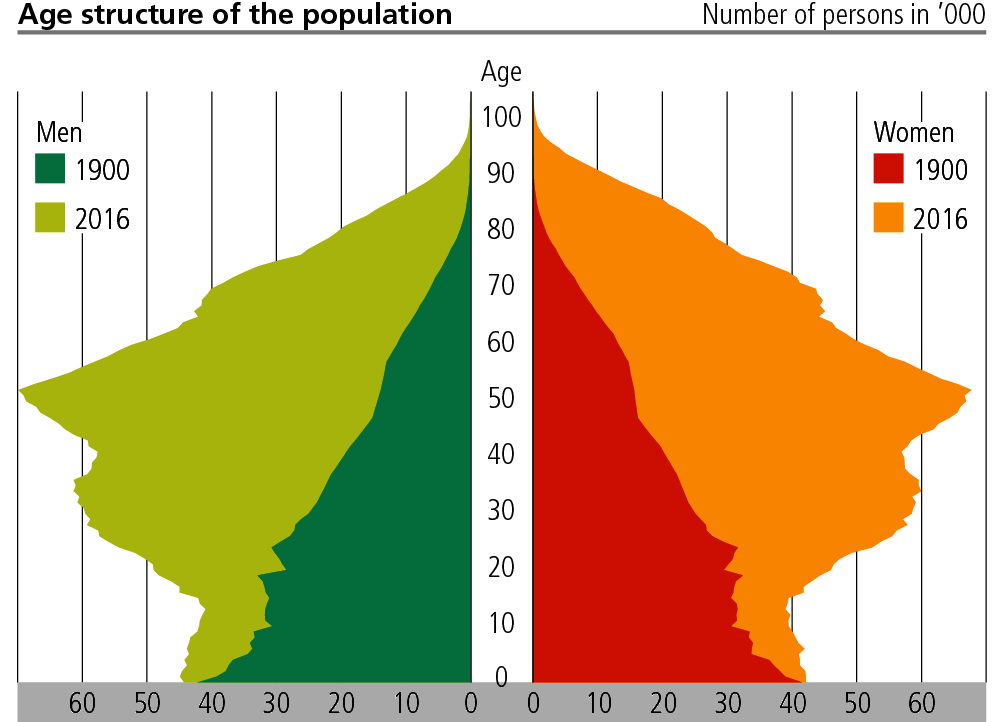
Ageing society
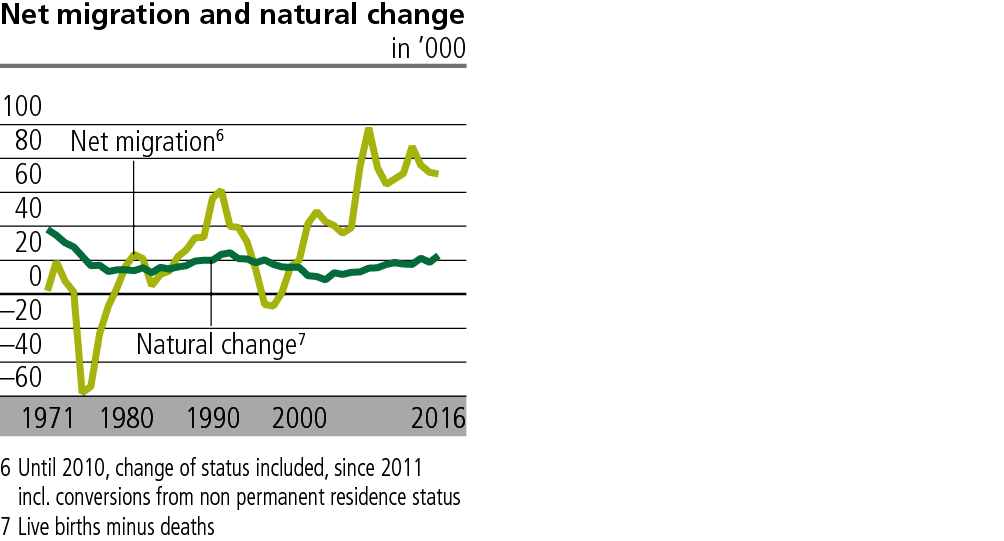
During the course of the 20th century, the proportion of elderly people (65 years or older) increased, while that of young people (under age 20) and people of working age (aged 20 – 64) declined. As a result of this process, the shape of the age “pyramid” has been transformed into one of a “fir tree” (2016) in which the baby boom generation (born between 1940 and 1971) predominates. Younger generations, in contrast, are smaller and the ageing of the population will continue. The proportion of persons aged 65 and over is expected to rise from 18.1% (2016) to over 26% in 2045. Switzerland’s population growth in the last few decades is mainly attributable to net immigration and to a lesser extent to an excess of births over deaths.
Chidren born alive, 2016
| Total | 87 883 |
| Boys for every 100 girls | 104.6 |
| Proportion of children out of wedlock in % | 24.2 |
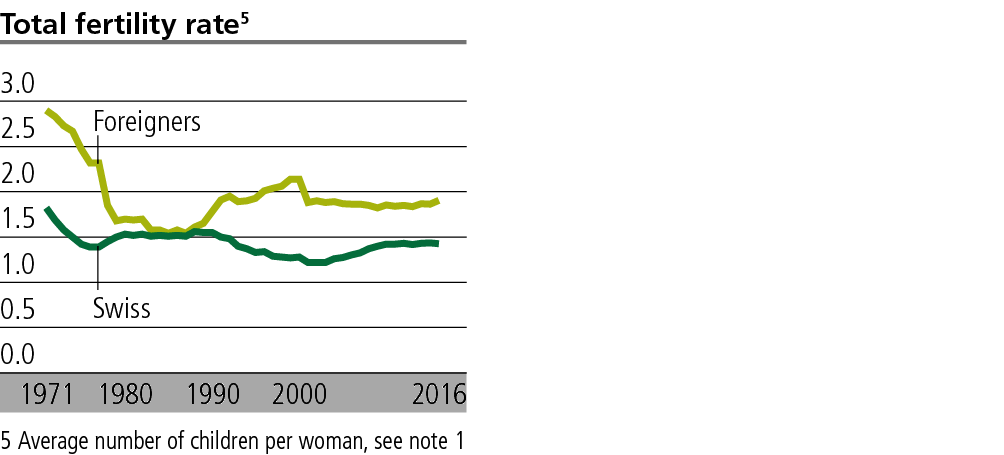
| Children per woman 1 | 1.5 |
1 Average number of children that would be born to a woman over her lifetime given the age-specific fertility rates in the year of observation
© FSO 2018
Multiple births 4, 2016
| Total | 1 708 |
| of which twin births | 1 668 |
4 Number of deliveries; children born alive and stillborn children
© FSO 2018
Deaths, 2016
| Total | 64 964 |
| Age at death (years) | |
| 0 – 19 | 475 |
| 20 – 39 | 841 |
| 40 – 64 | 7 407 |
| 65 – 79 | 16 264 |
| ≥ 80 | 39 977 |
© FSO 2018
International migration, 2016
| Immigration | 191 683 |
| of which foreigners | 167 407 |
| Emigration | 120 653 |
| of which foreigners | 90 088 |
| Net migration | 71 030 |
| Swiss | −6 289 |
| Foreigners | 77 319 |
© FSO 2018
Internal migration 2, 2016
| Total movements | 521 521 |
2 Movements between communes, excl. movements within a given commune
© FSO 2018
Marriages, 2016
| Total | 41 646 |
| Swiss/Swiss | 19 821 |
| Swiss/Foreign | 8 239 |
| Foreign/Swiss | 6 879 |
| Foreign/Foreign | 6 707 |
| Average age at first marriage (years) | |
| Single men | 32.0 |
| Single women | 29.8 |
© FSO 2018
Divorces, 2016
| Total | 17 028 |
| with minors involved in % | 46.9 |
| Duration of marriage | |
| 0 – 4 years | 2 020 |
| 5 – 9 years | 4 183 |
| 10 – 14 years | 3 356 |
| 15 or more years | 7 469 |
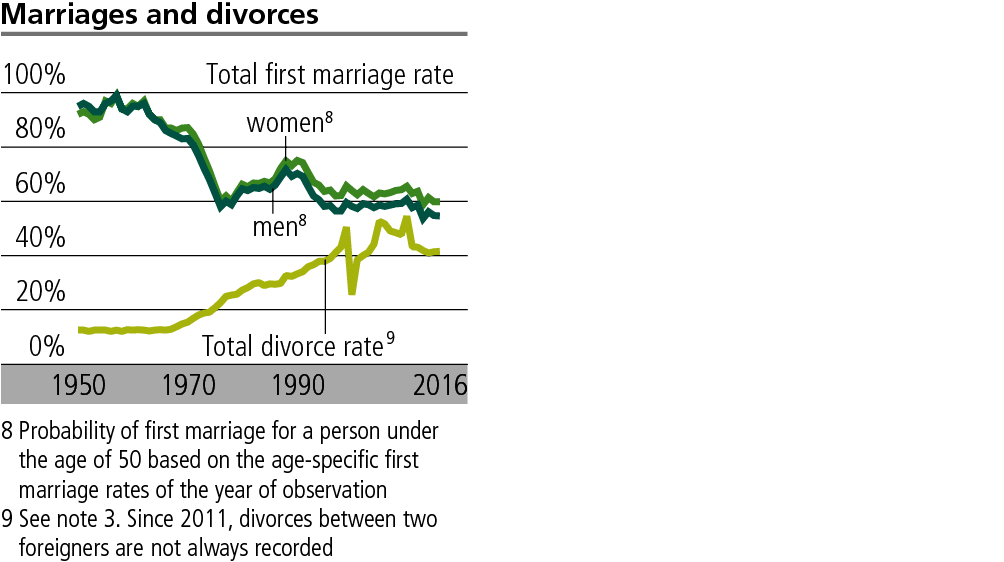
| Total divorce rate 3 | 41.5 |
3 Proportion of marriages, ending in divorce sooner or later, based on the divorce rates of the year of observation
© FSO 2018
Foreign permanent and non permanent resident population by type of permit, 2016
| in 1000 | |
|---|---|
| Total | 2 178.9 |
| Resident – B permit | 689.7 |
| Permanent resident – C permit | 1 297.2 |
| International officials and diplomats | 29.4 |
| Temporary resident (L permit) | 86.7 |
| Asylum seekers – N permit | 31.4 |
| Provisionally accepted – F permit | 36.9 |
| Non-attributable | 7.5 |
© FSO 2018

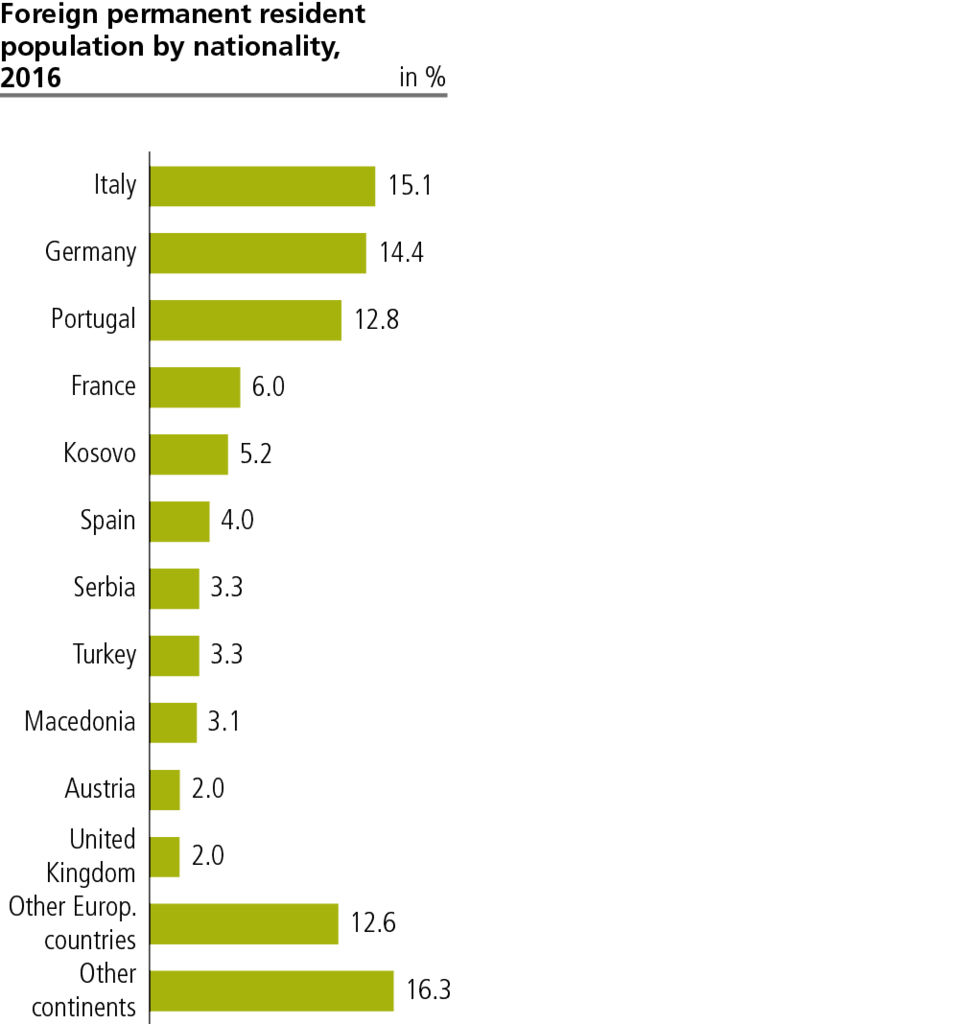
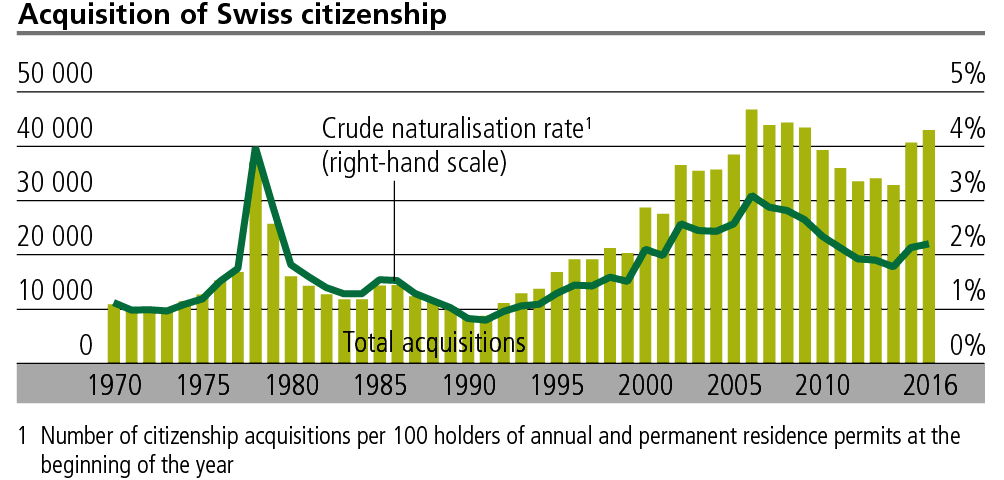
Foreign population: more than half were born in Switzerland or have been residents for at least 10 years
Foreigners account for 25% of the permanent resident population. More than half of the residents without a Swiss passport (54.9%) have lived in the country for 10 years or more or were even born here. In 2016, 42 937 persons (2.2% of the foreign permanent resident population) obtained Swiss citizenship. The foreign population is young: for every 100 foreigners of working age (aged 20 – 64) there are only 11 aged 65 and over (compared with 37 among the Swiss). 29.9% of children born in Switzerland in 2016 had foreign citizenship. In 2016, the number of immigrations increased by 1.7% compared with the previous year. Of these immigrants, 54% came from EU/ EFTA countries.
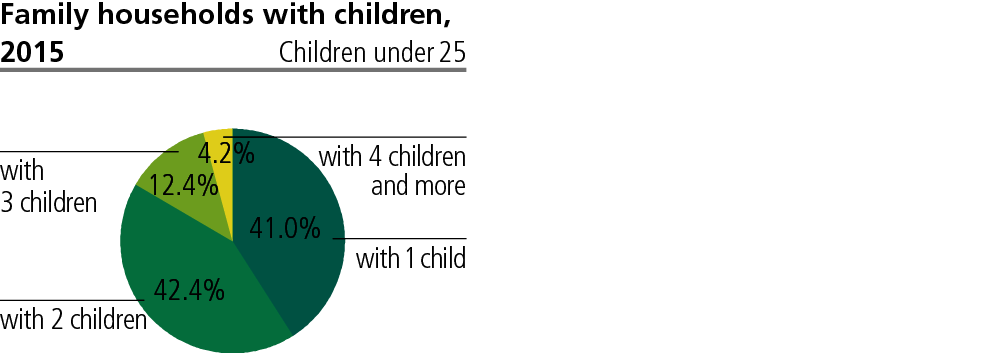
Increasingly multifaceted living patterns
In 2013–2015, only 29% of private households belonged to the household type “Couple with children”. Of the households with at least one child under 25 years 14% are lone parent families and 5.5% patchwork families. These high figures are the result of a great number of divorces (17 028 in 2016). Furthermore the proportion of non-marital births doubled between 2000 and 2016, from 11% to 24%.
The decision to get married and start a family is being made increasingly late in life: The age at first marriage among women rose from 24 (1970) to 30 (2016) and among men from 26 to 32 years; the average age of mothers at first birth rose from 25 to 31 years.
The traditional middle-class “single breadwinner” model is now the exception: In 2016, almost eight in ten mothers in couple households were in employment. It still holds true that fathers tend to do more paid work (generally full-time) and mothers are mainly responsible for house and family work.
Private households, 2015
in 1000
| Total | 3 623.3 |
| Single-person households | 1 273.8 |
| Family households | 2 323.7 |
| Childless couples | 995.9 |
| Couples with child(ren) | 1 028.4 |
| Lone parents with child(ren) | 218.5 |
| Non-family households | 80.8 |
© FSO 2018
Main languages, 2015 1
in %
| German | 64.1 |
| French | 22.7 |
| Italian | 8.4 |
| Romansh | 2.5 |
| English | 2.7 |
| Portuguese | 3.7 |
| Albanian | 2.3 |
| Serbo-Croatian | 5.4 |
| Spanish | 1.1 |
| Turkish | 0.6 |
| Other languages | 5.8 |
1 Resident permanent population aged 15 or more and living in a private household. Several languages possible
© FSO 2018
Religious affiliation, 2015 2
in %
| Protestant | 24.9 |
| Roman Catholic | 37.3 |
| Other Christian communities | 5.8 |
| Jewish religious community | 0.2 |
| Islamic religious communities | 5.1 |
| Other churches and religious communities | 1.4 |
| No affiliation | 23.9 |
| Unknown | 1.3 |
2 Resident permanent population aged 15 or more and living in a private household
© FSO 2018